Metrics Monitoring and Alerting System
5 min readDesign a scalable metrics monitoring and alerting system for internal use by a large company. Out of scope: log monitoring and distributed tracing.
Figure 1 Popular services
Step 1 - Understand the Problem and Establish Design Scope
Requirements
- Monitor operational system metrics: CPU load, memory, disk space, requests/sec, server count. Not business metrics.
- Scale: 100M DAU, 1,000 server pools × 100 machines/pool × 100 metrics/machine → ~10M metrics.
- Data retention policy:
- Raw data: 7 days
- 1-minute resolution: 30 days
- 1-hour resolution: 1 year
- Alert channels: email, phone, PagerDuty, webhooks.
Non-functional requirements
- Scalable for growing metrics/alert volume.
- Low query latency for dashboards and alerts.
- Highly reliable (no missed critical alerts).
- Flexible pipeline for future technology integration.
Step 2 - Propose High-Level Design and Get Buy-In
Five components
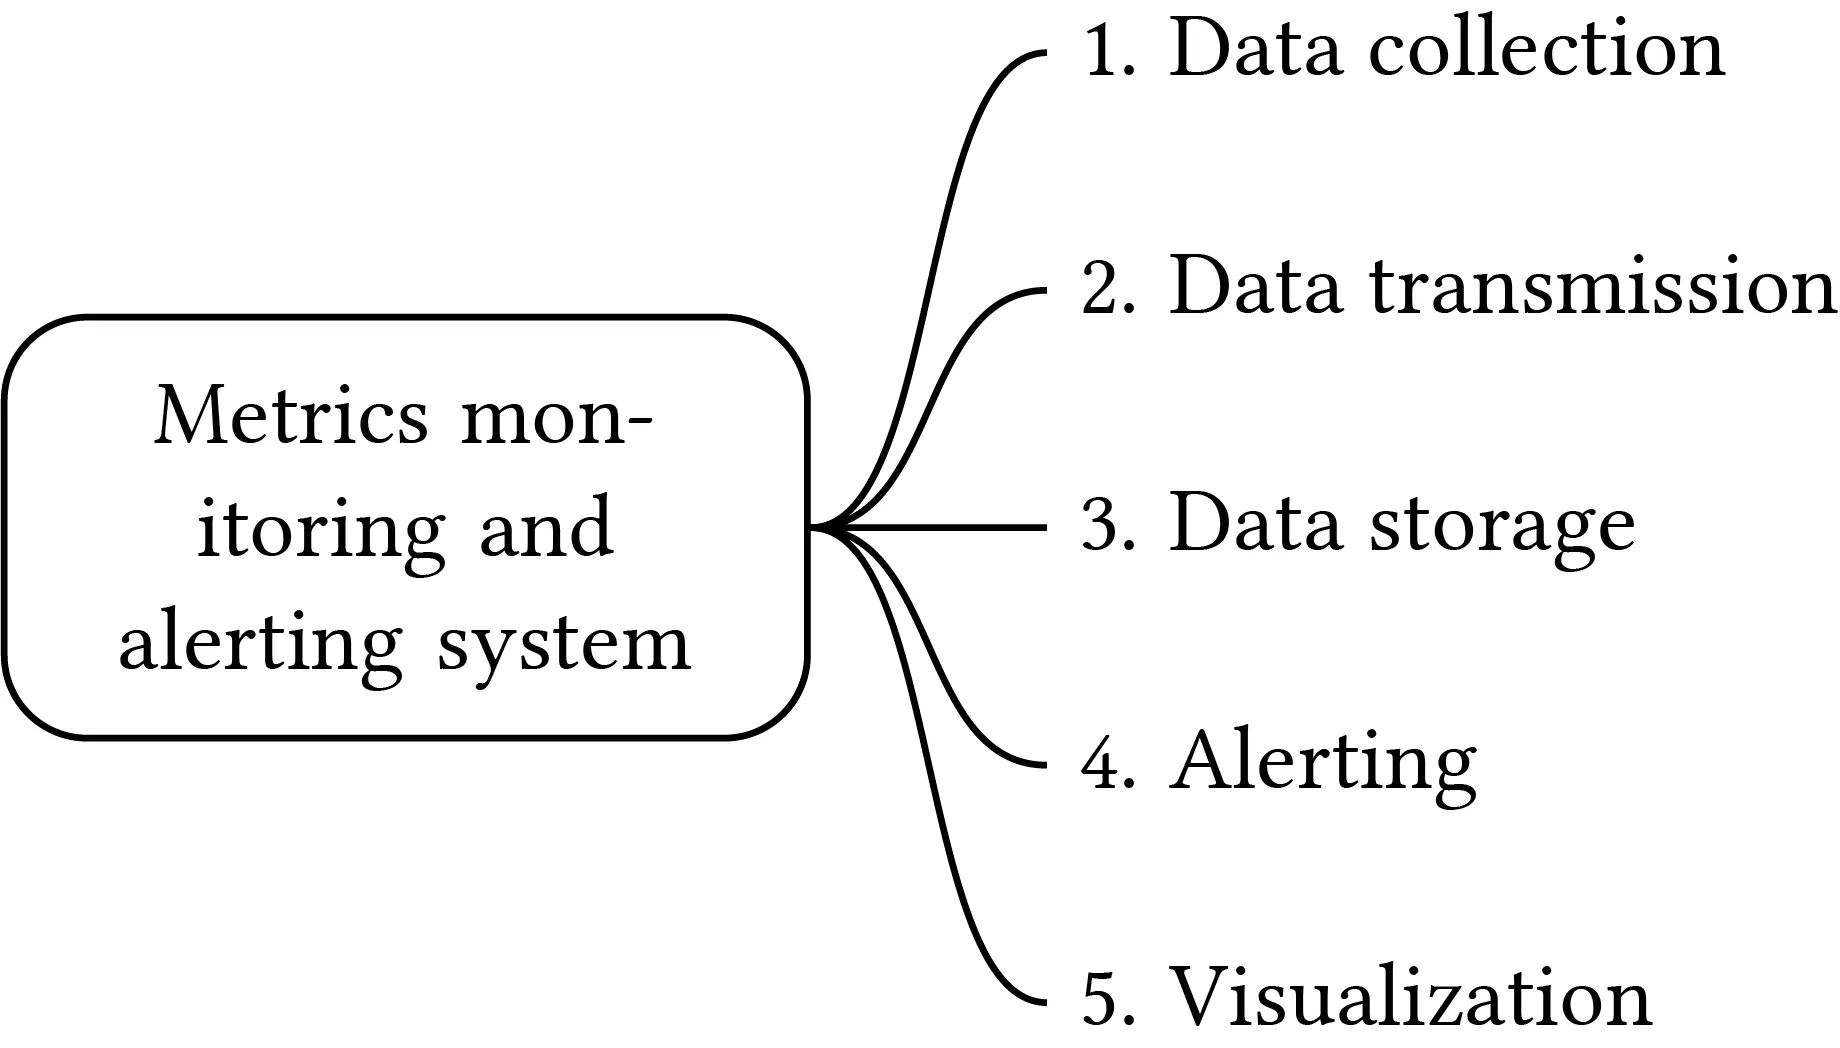
- Data collection: Gather metrics from sources.
- Data transmission: Transfer to monitoring system.
- Data storage: Organize and store incoming data.
- Alert: Detect anomalies, generate alerts, send to channels.
- Visualization: Present data in graphs/charts.
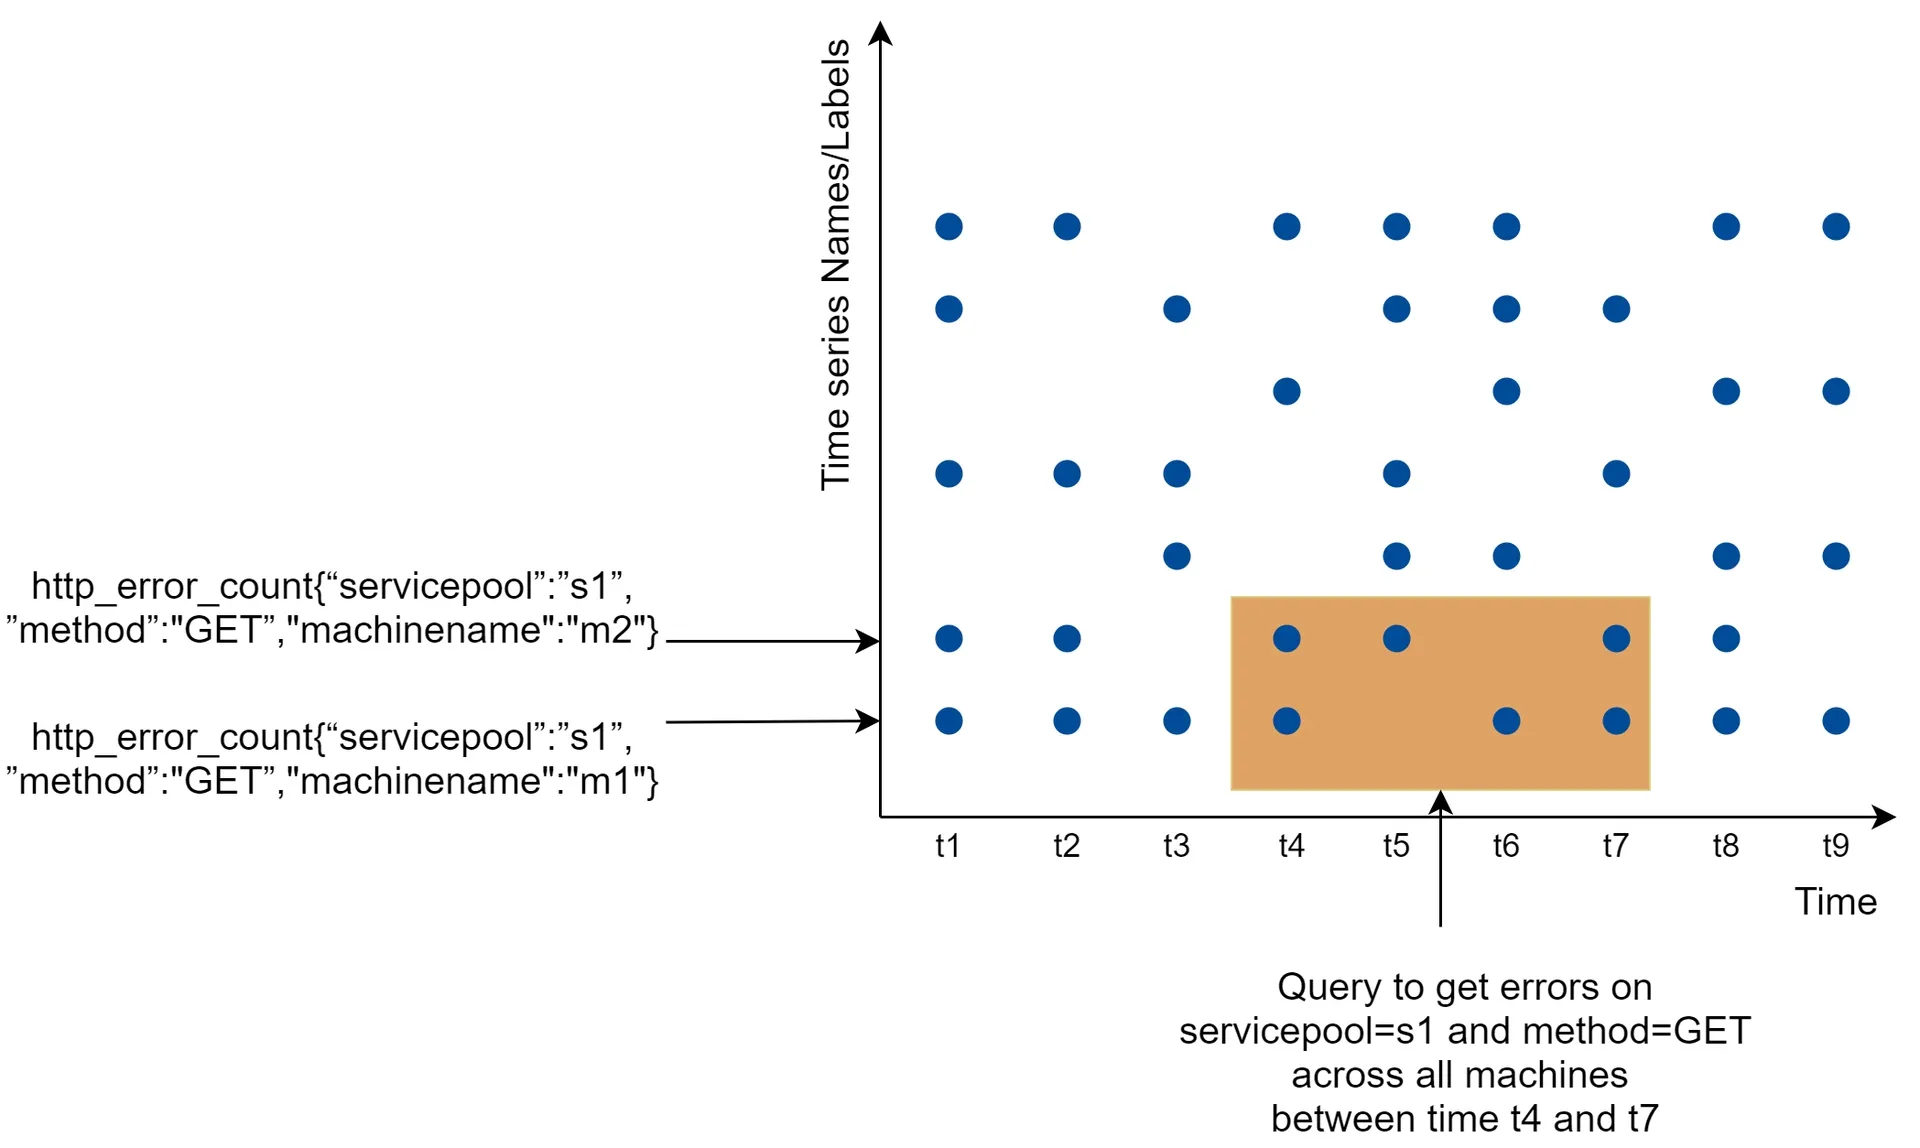
Data model
Metrics = time series: uniquely identified by metric name + labels (tags).
Format (line protocol):
CPU.load host=webserver01,region=us-west 1613707265 50
Time series structure:
| Field | Type |
|---|---|
| Metric name | String |
| Tags/labels | List of <key:value> pairs |
| Values | Array of <value, timestamp> pairs |
Data access pattern
- Write-heavy: ~10M operational metrics written per day at high frequency.
- Read-spiky: Visualization + alert queries → bursty read volume.
Data storage system
Do NOT build your own or use general-purpose DB (MySQL). Relational DB not optimized for time-series (complex SQL for moving averages, index per tag needed, poor under constant heavy write).
NoSQL (Cassandra, Bigtable): Can work but requires deep internal knowledge for scalable schema.
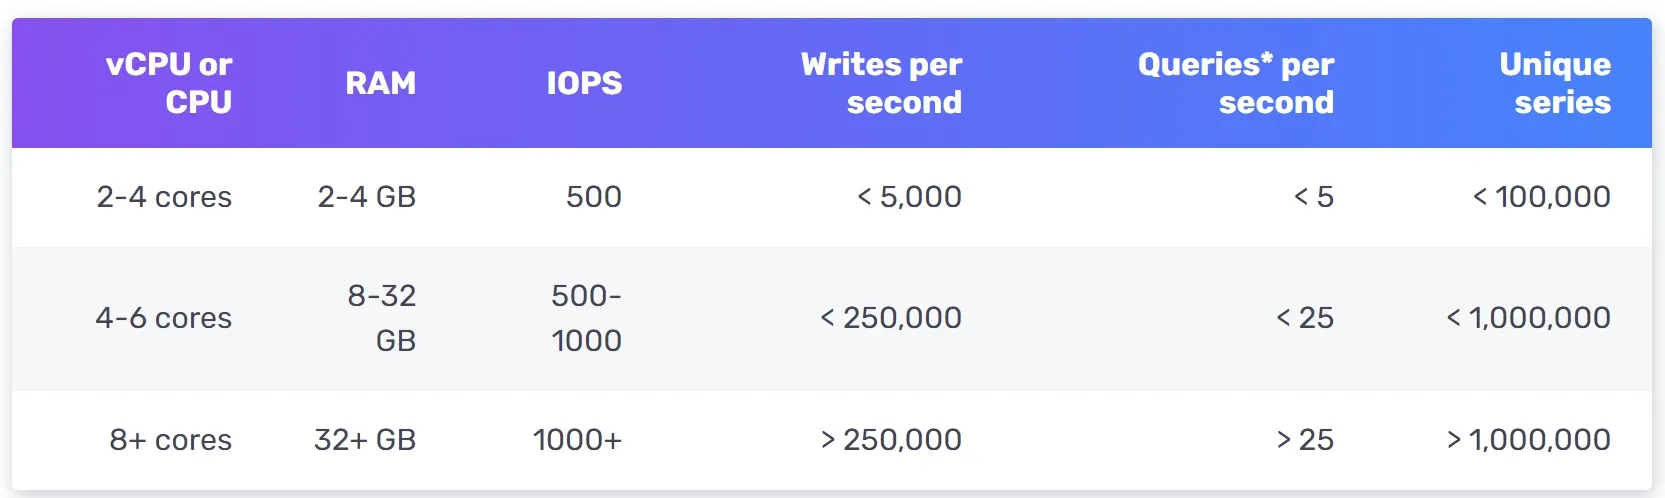
Time-series databases (recommended): OpenTSDB (HBase-based → complex), InfluxDB, Prometheus. InfluxDB: 8 cores + 32GB RAM → 250K+ writes/sec. Strong label-based indexing for fast aggregation/analysis. Key: keep labels low cardinality.
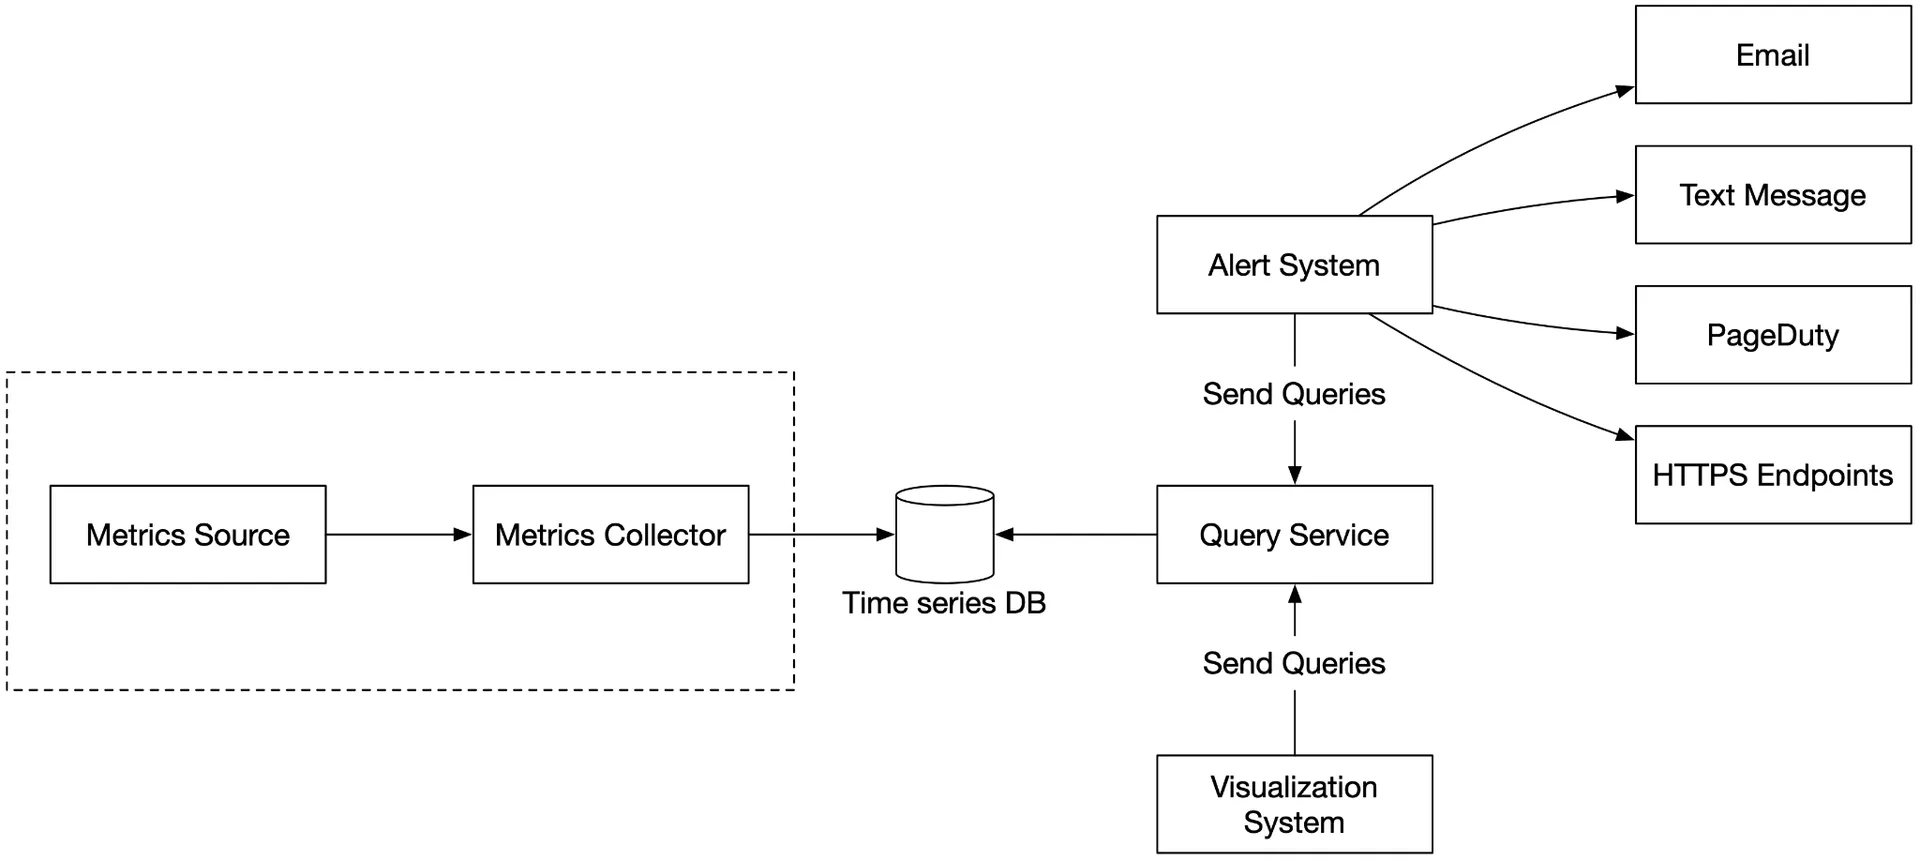
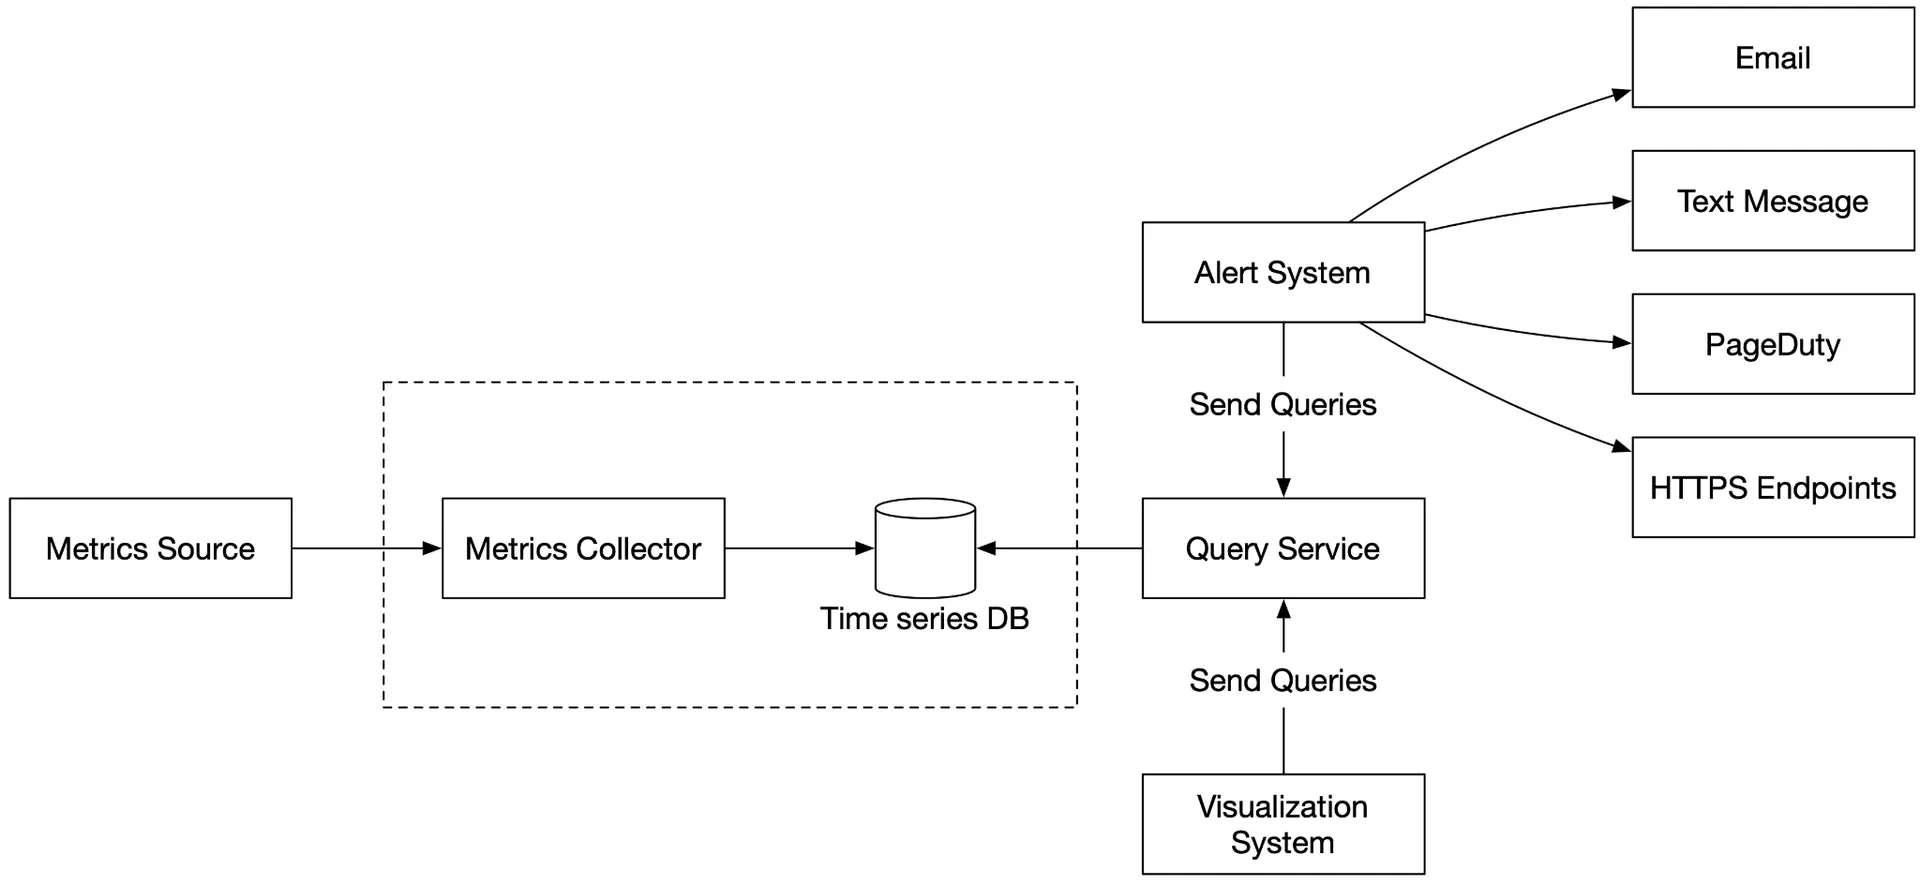
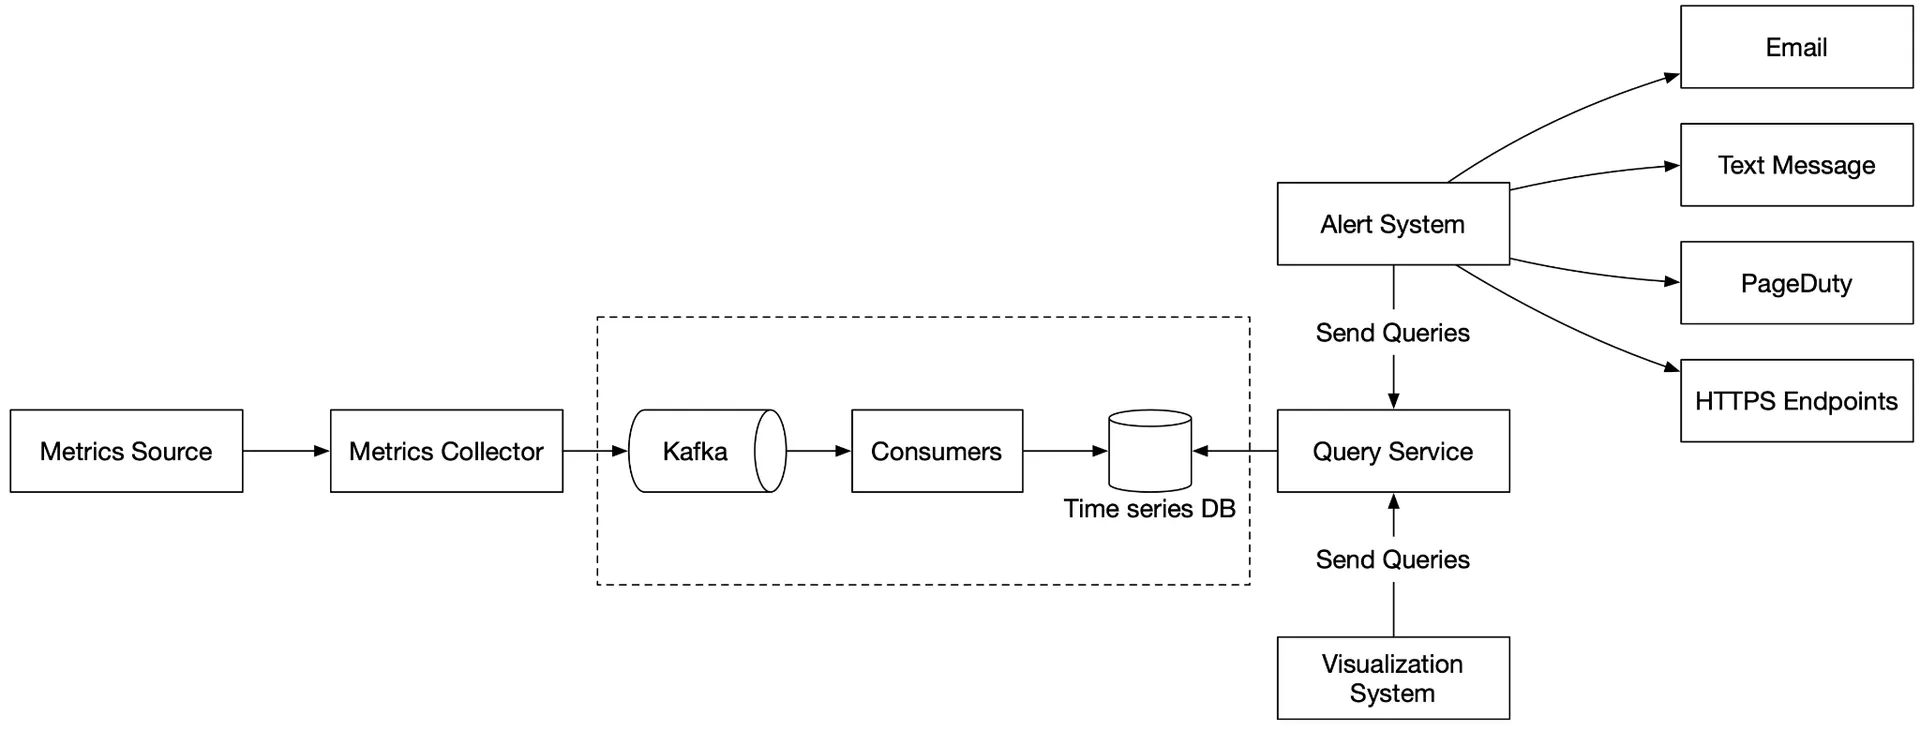
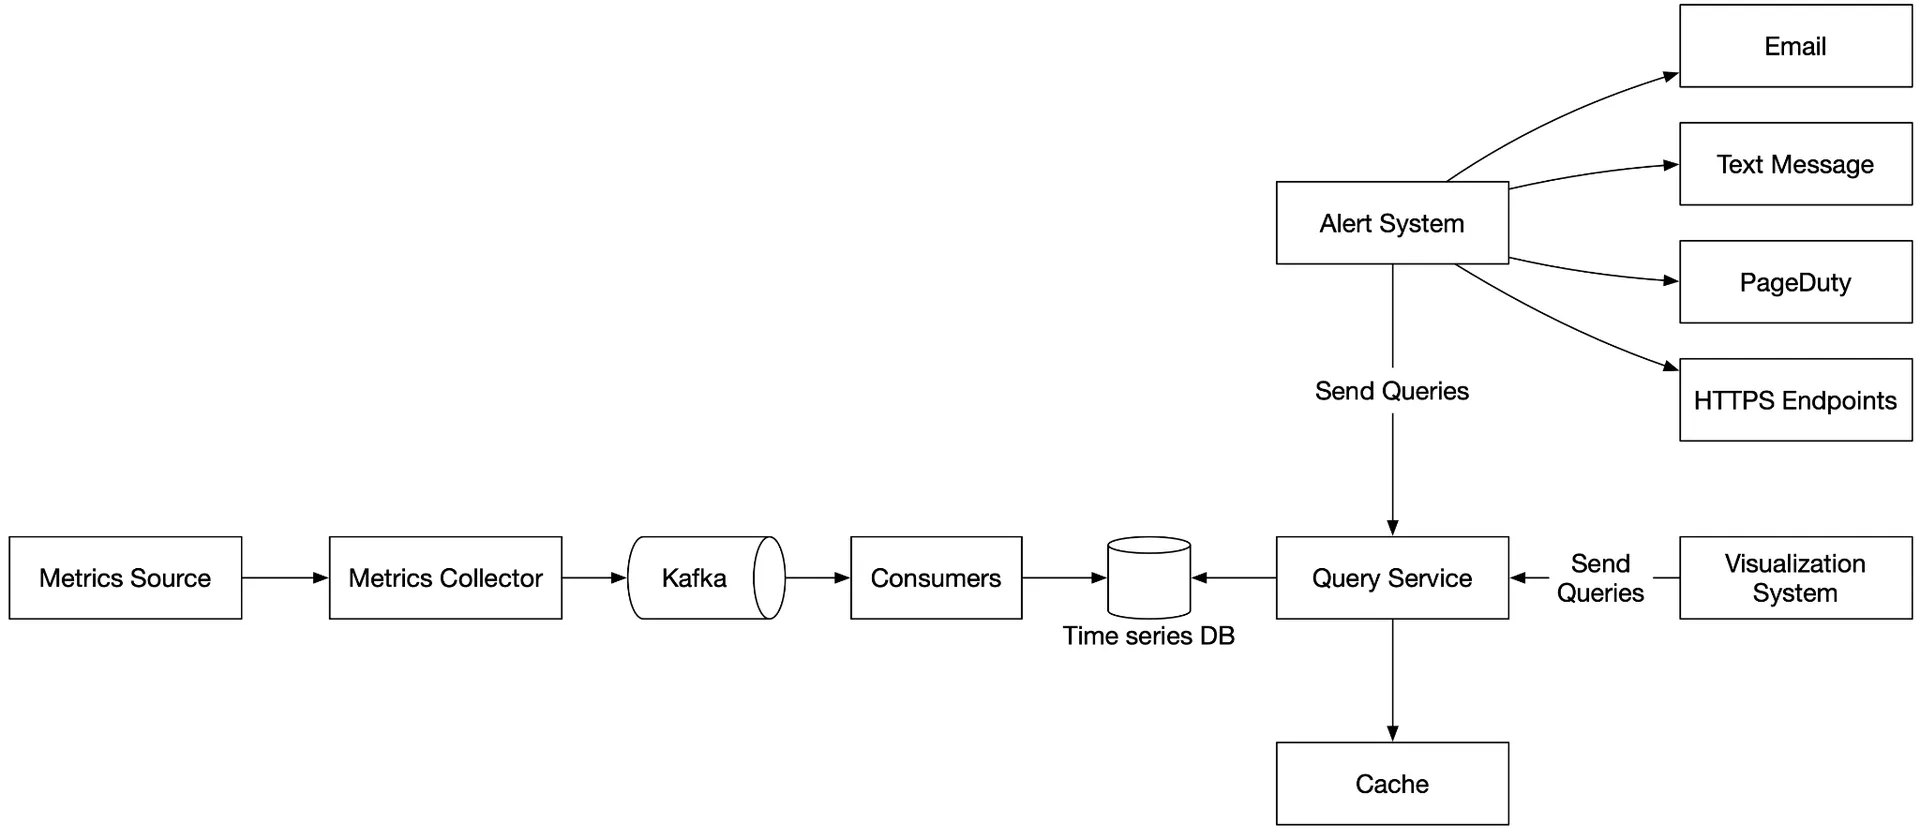
High-level design

- Metrics source: App servers, SQL DBs, message queues.
- Metrics collector: Gathers + writes to time-series DB.
- Time-series database: Stores time-series; custom query interface; label indexes.
- Query service: Thin wrapper for querying; could be replaced by DB's own interface.
- Alerting system: Sends notifications.
- Visualization system: Graphs/charts.
Step 3 - Design Deep Dive
Metrics collection
Occasional data loss acceptable (counters, CPU). Fire-and-forget OK.
Pull vs Push
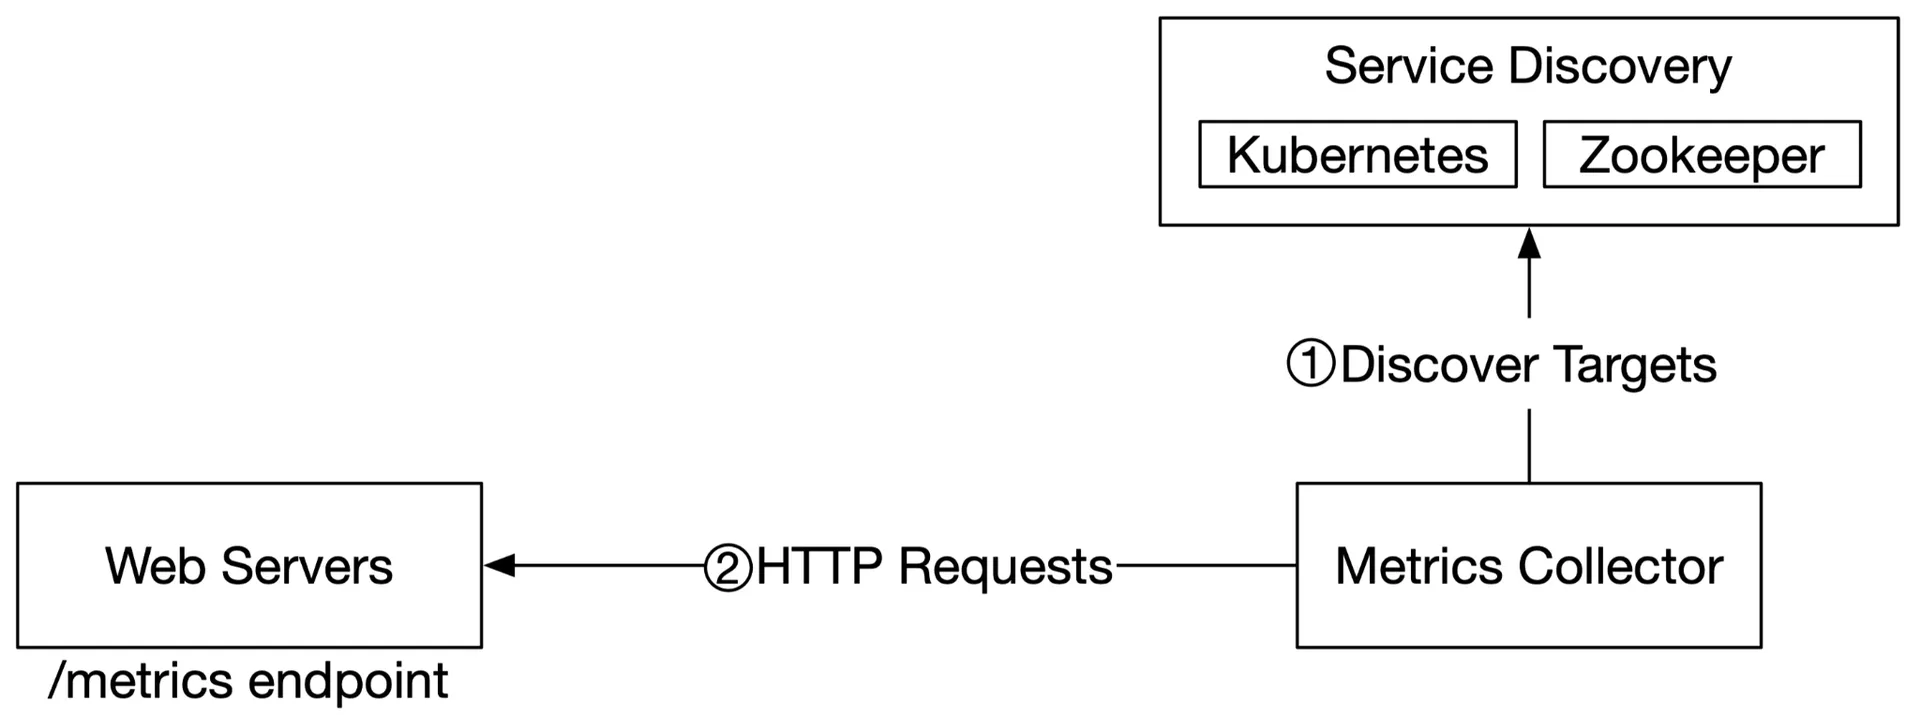
Pull model:
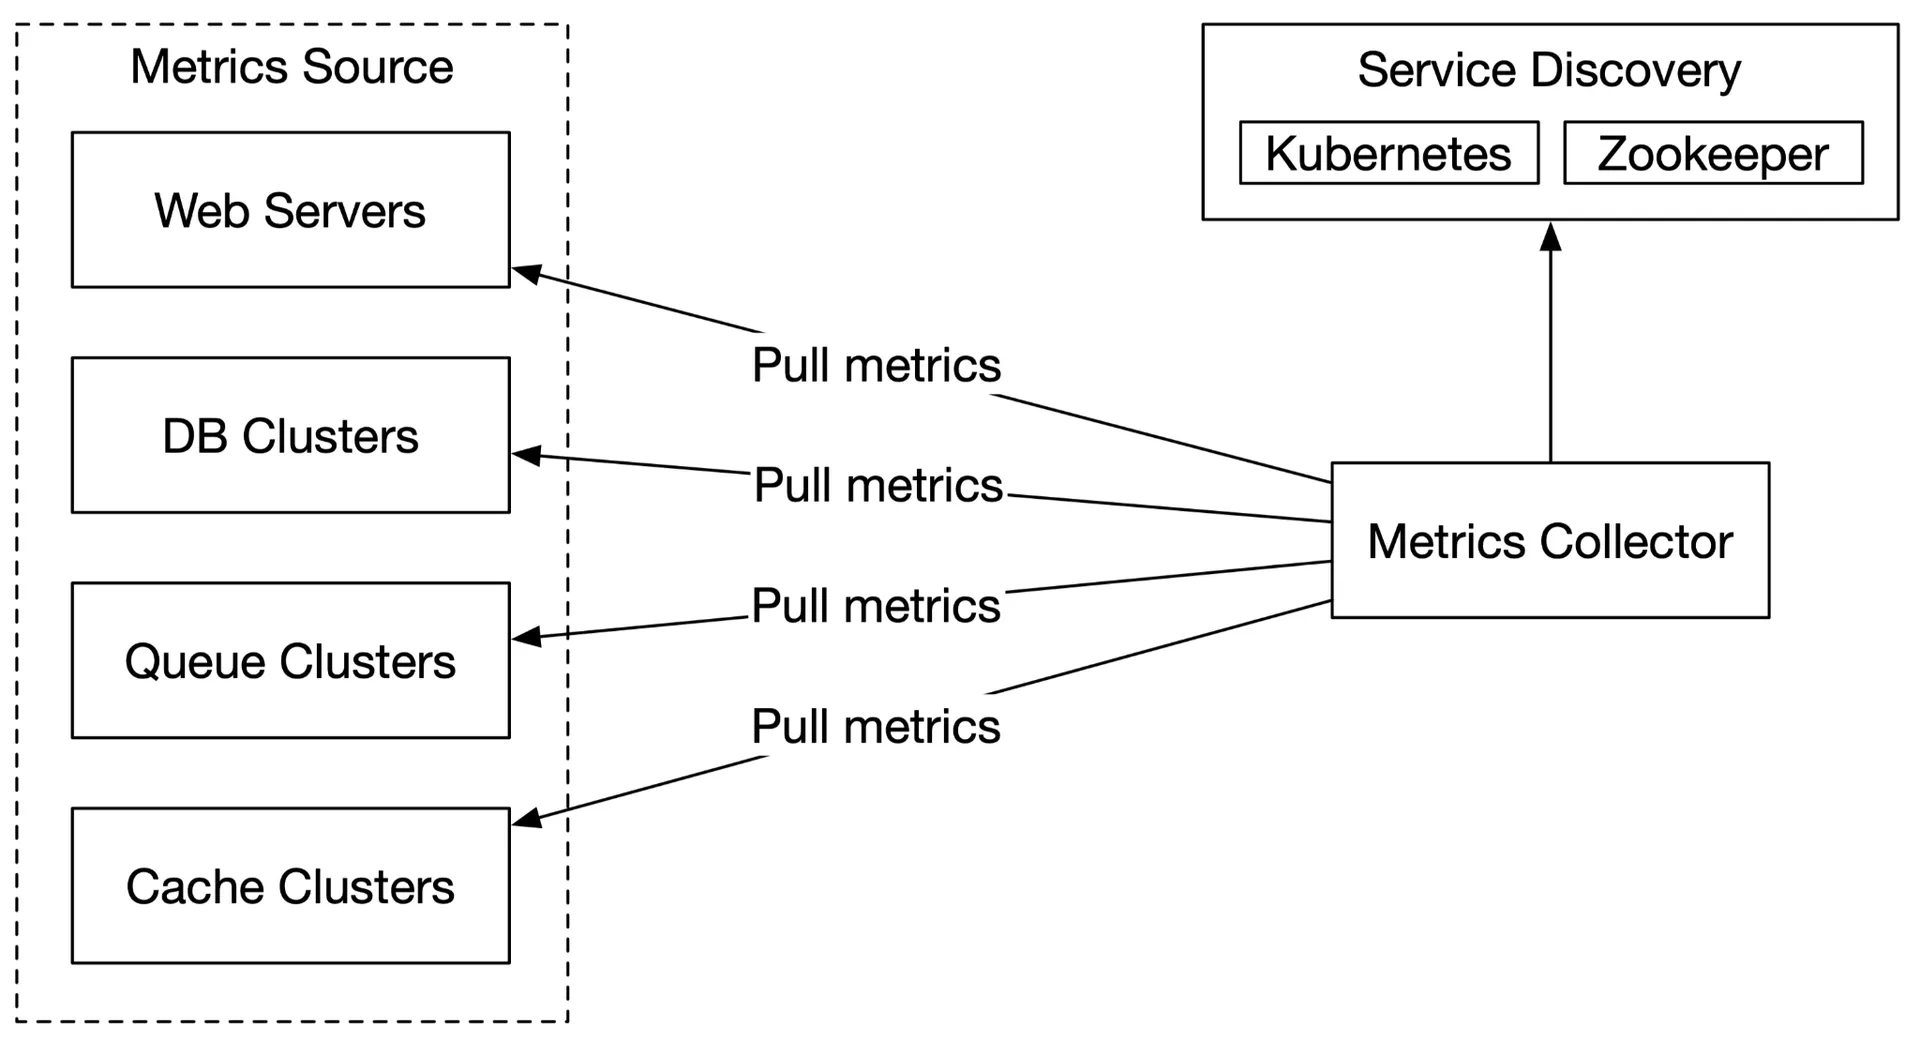
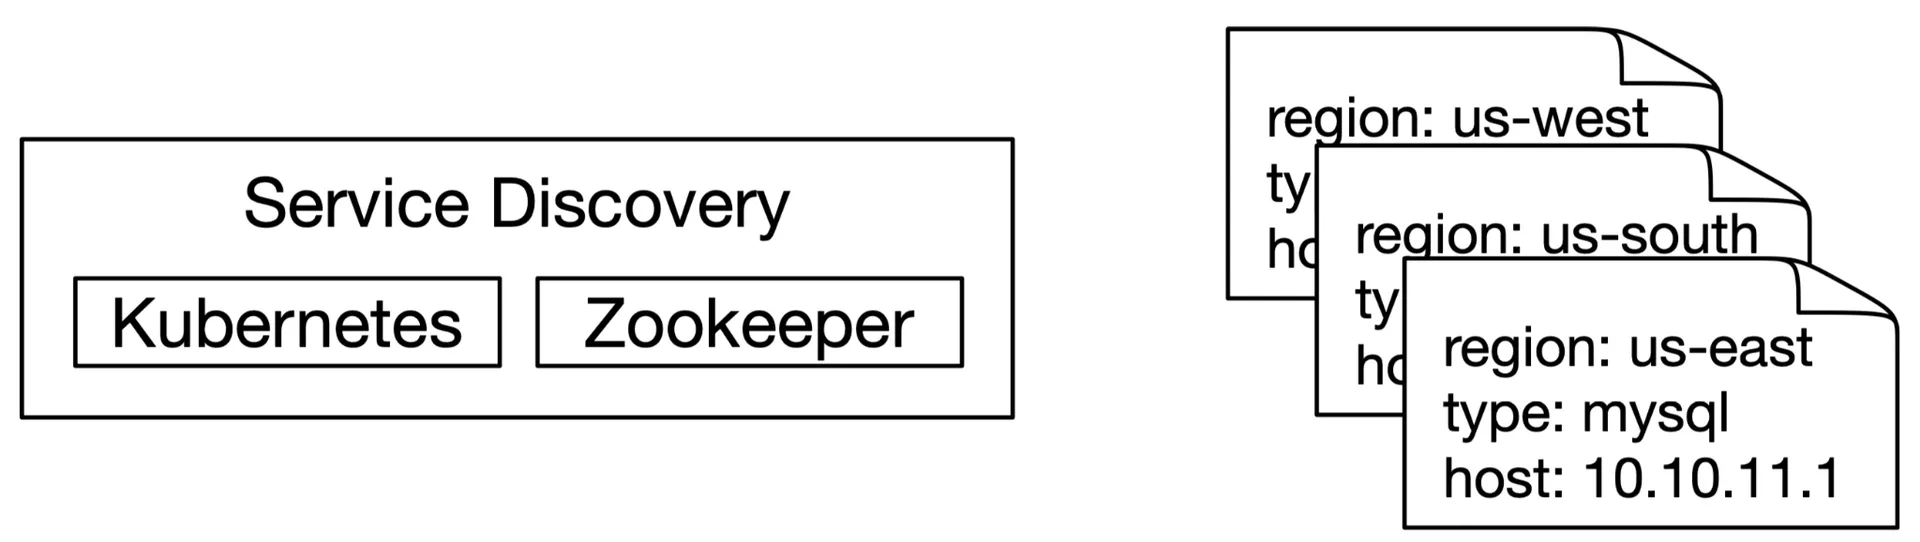
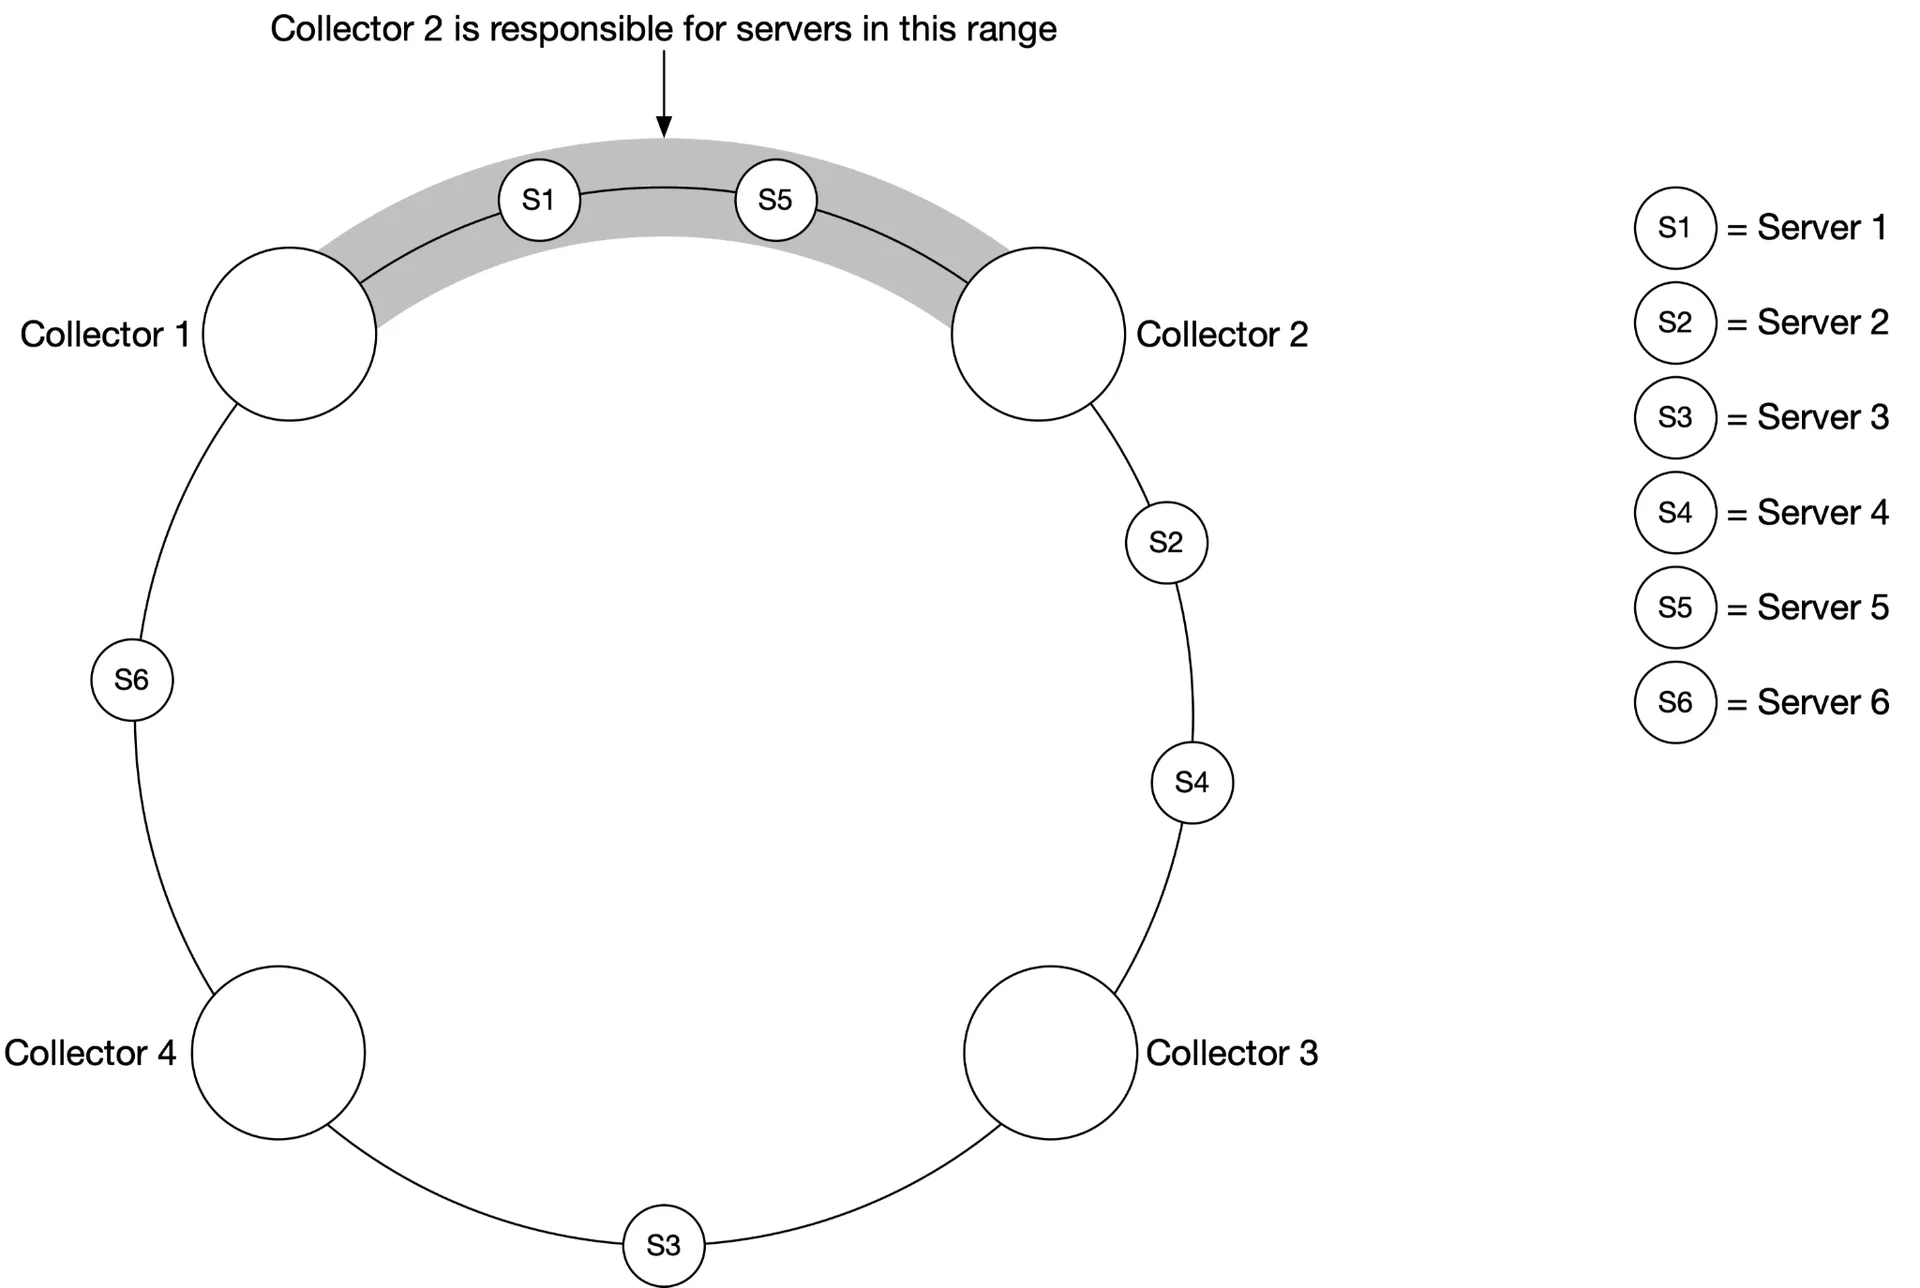
Dedicated metric collectors pull from application /metrics endpoints periodically. Uses Service Discovery (etcd/Zookeeper) to know endpoints. Collectors subscribe to endpoint changes.
Multiple collectors → must avoid duplicate pulls. Use consistent hashing: each collector assigned a range; each monitored server maps to exactly one collector.
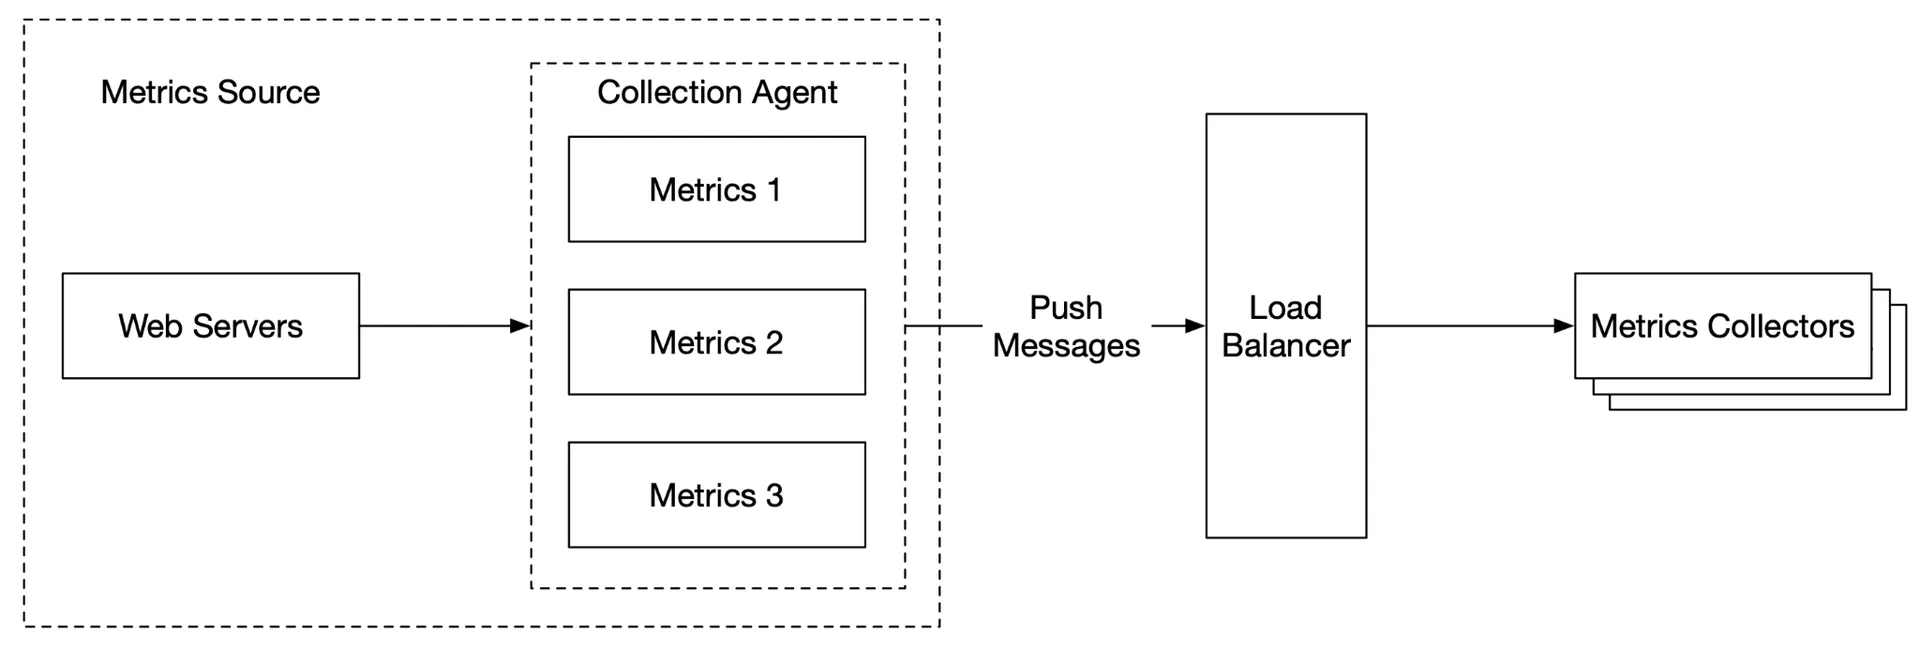
Push model:
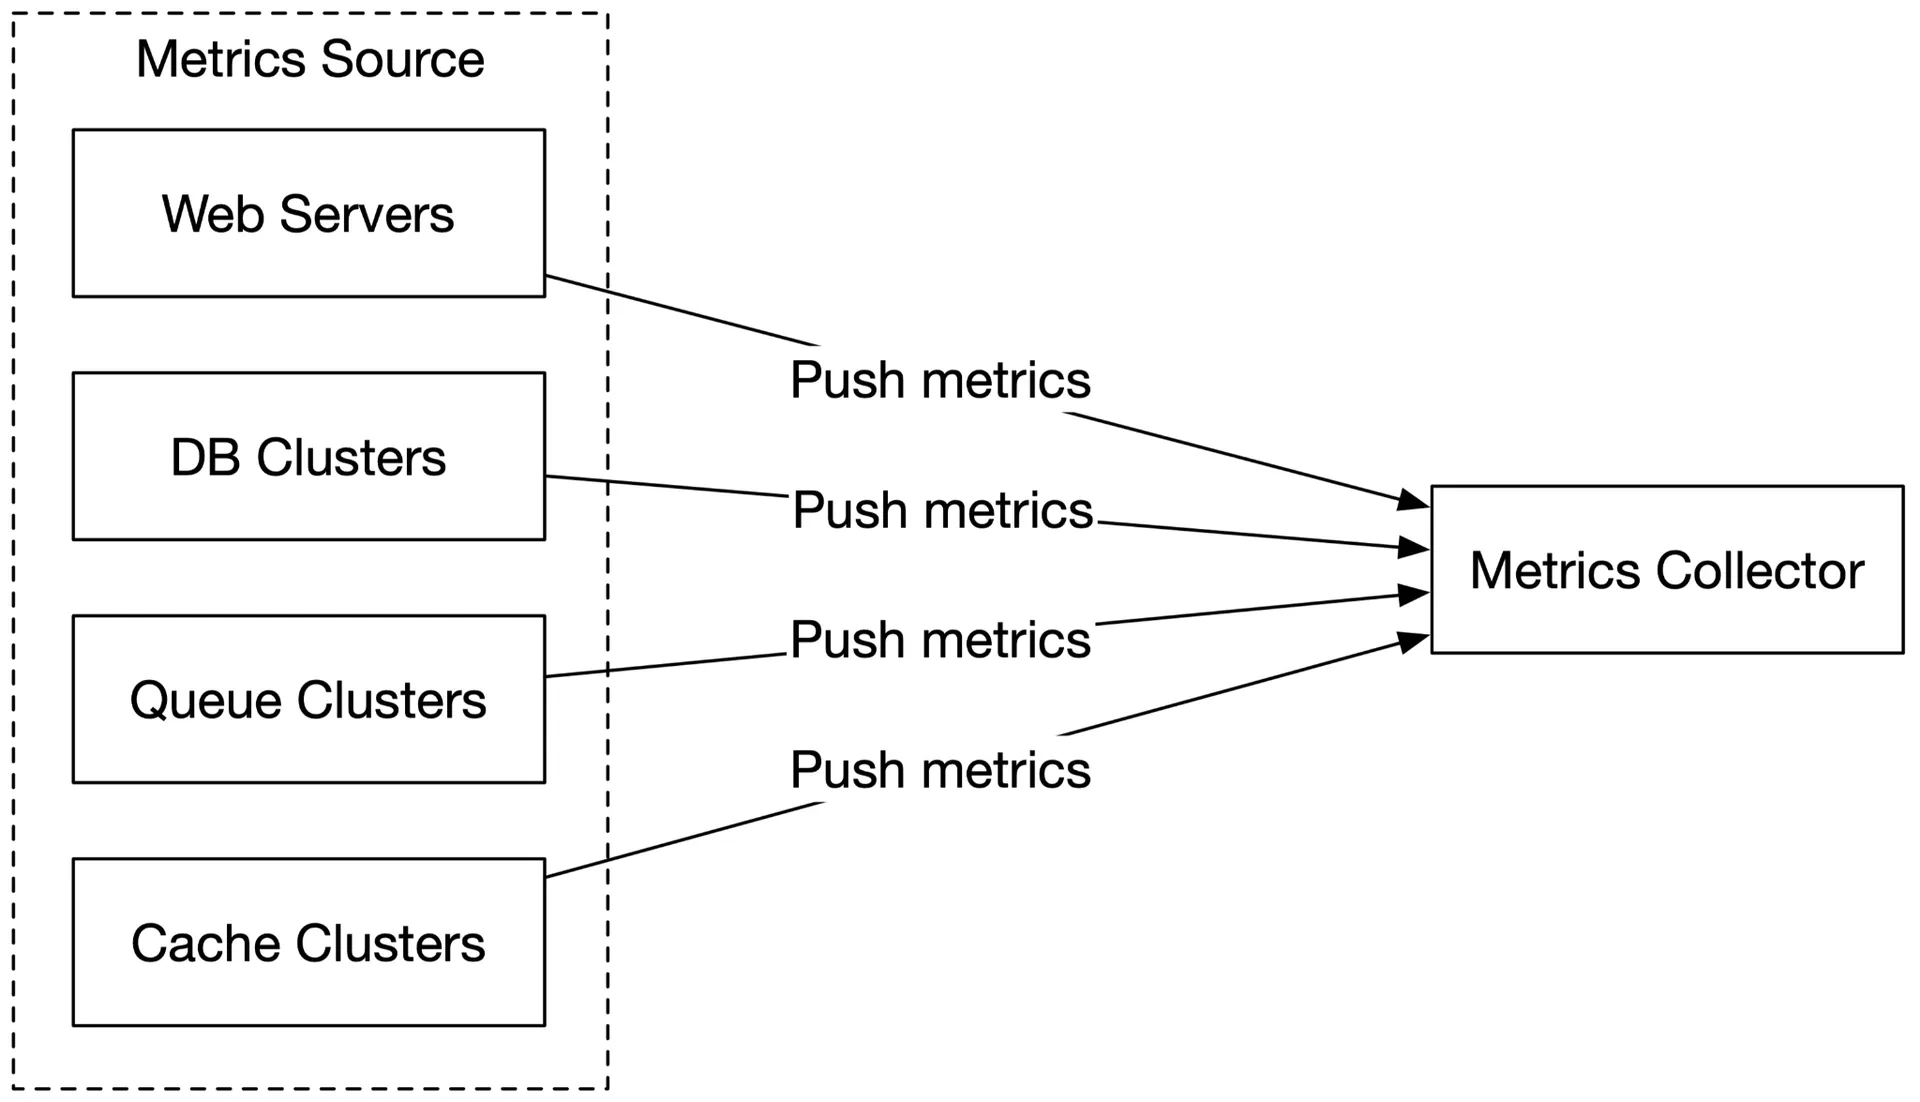
Collection agent installed on each server → pushes metrics to collector. Can aggregate locally before sending. Buffer locally if collector rejects (risk: data loss if servers are auto-scaled out). Collector cluster with load balancer + auto-scaling.
Pull vs Push comparison
| Aspect | Pull | Push |
|---|---|---|
| Easy debugging | ✓ View /metrics endpoint anytime | |
| Health check | ✓ No response = down | Network issues ambiguous |
| Short-lived jobs | Needs push gateway workaround | ✓ |
| Firewall/complex network | All endpoints must be reachable | ✓ LB + auto-scale accepts from anywhere |
| Performance | TCP | UDP (lower latency) |
| Data authenticity | Pre-defined config → guaranteed | Any client (mitigated by whitelist/auth) |
- Pull examples: Prometheus
- Push examples: Amazon CloudWatch, Graphite
- Large orgs likely need both (serverless complicates agent installation).
Scale the metrics transmission pipeline
Introduce Kafka between collector and time-series DB:
- Highly reliable, scalable message platform.
- Decouples collection from processing.
- Prevents data loss when DB unavailable (data retained in Kafka).
Scale through Kafka
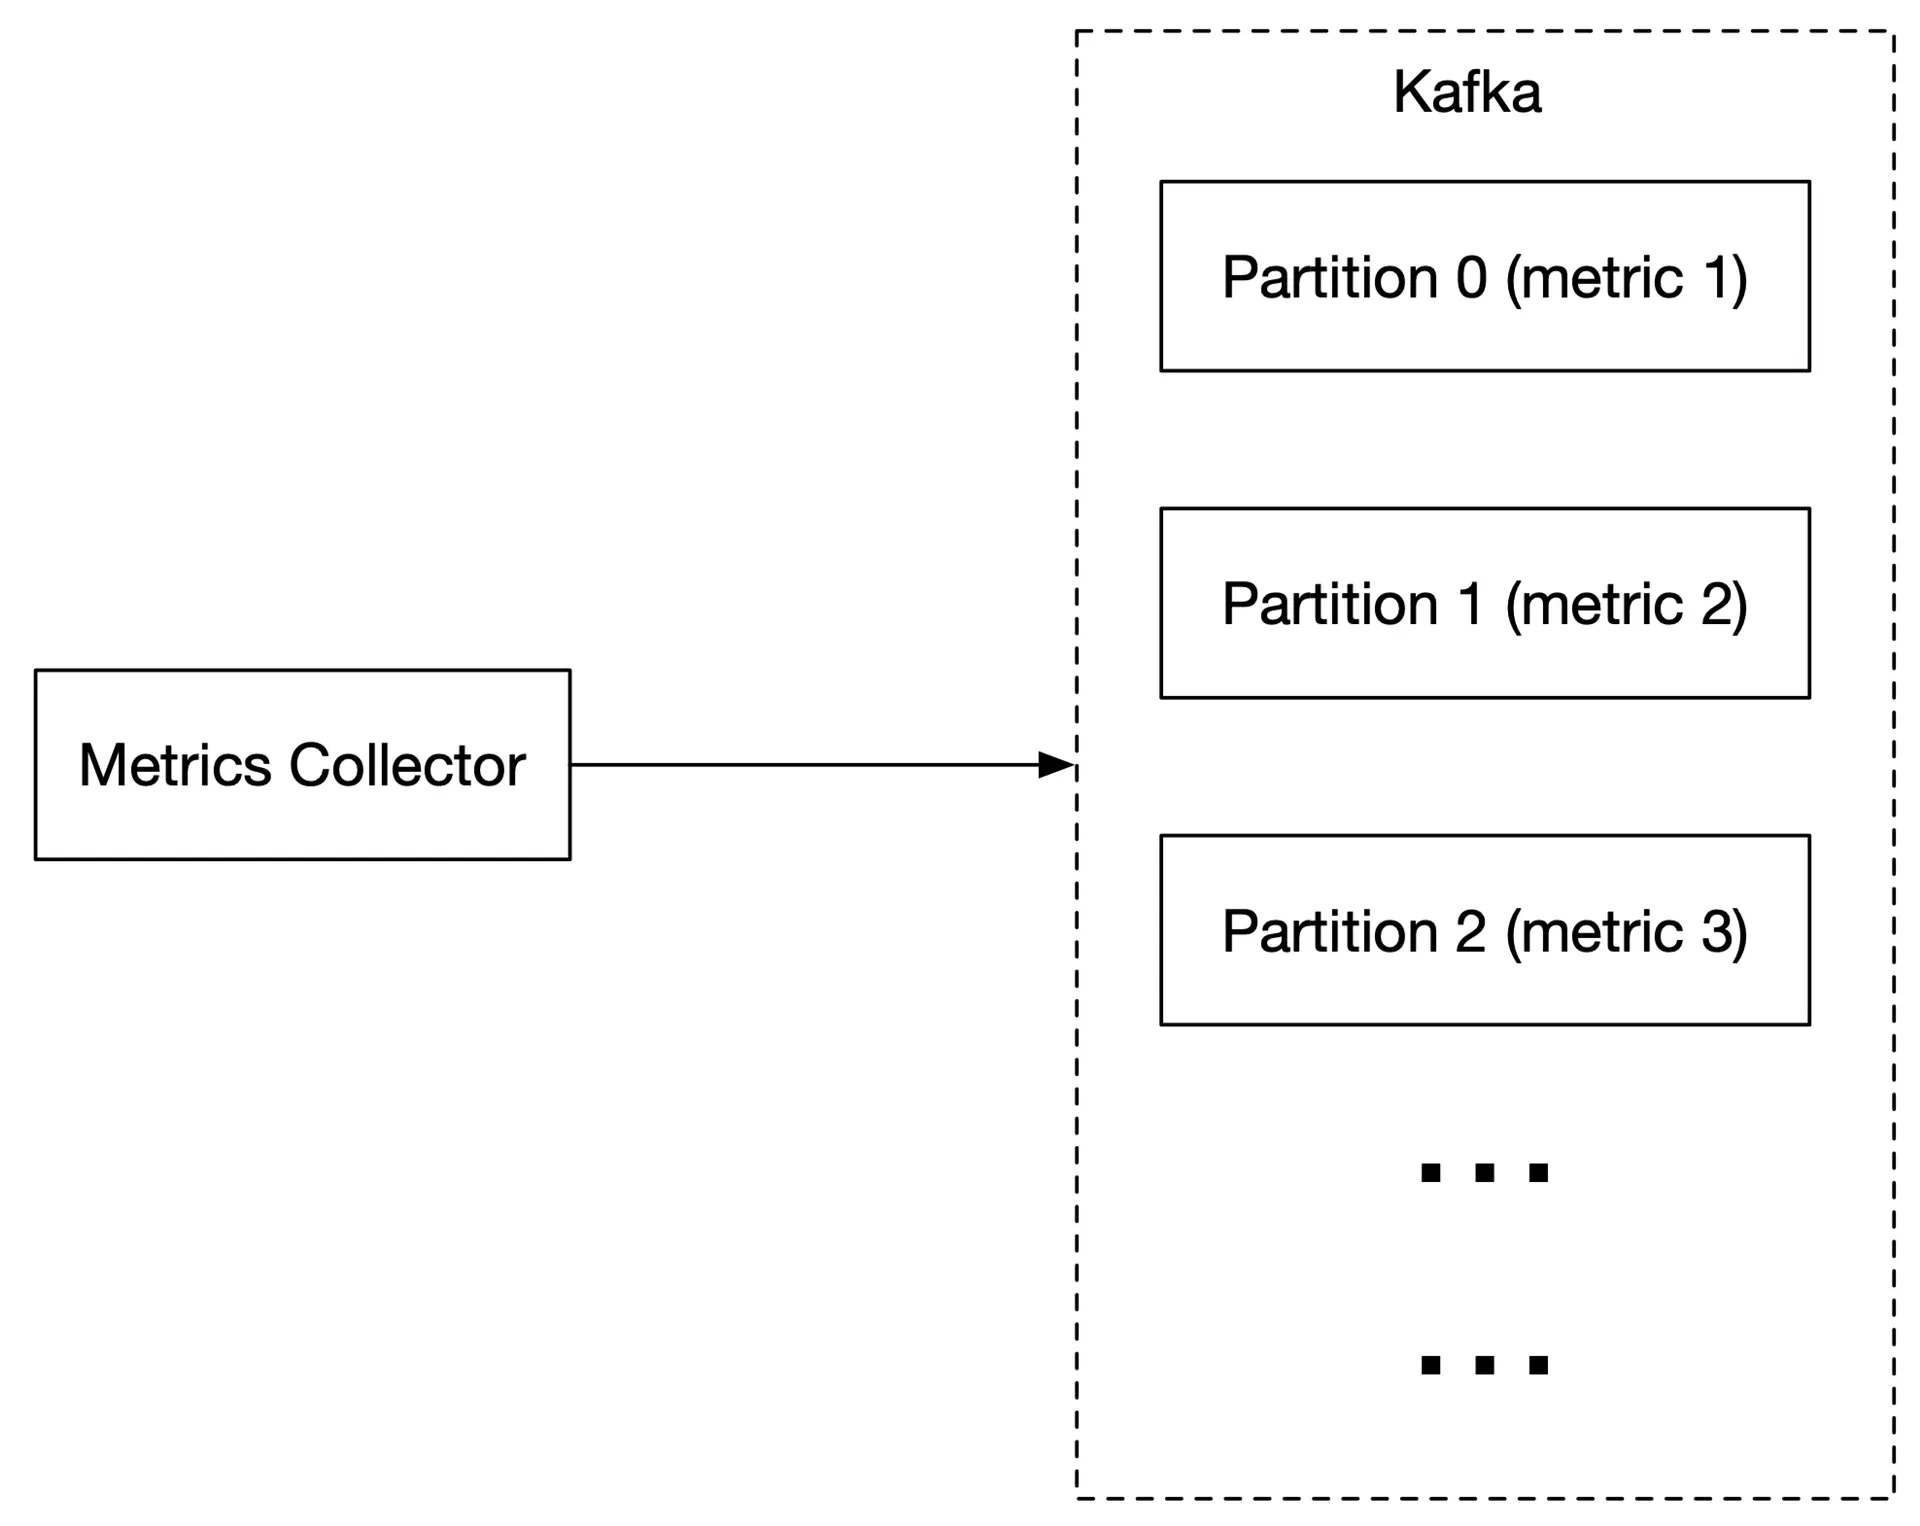
- Configure partitions by throughput.
- Partition by metric name → consumers can aggregate by metric name.
- Further partition by tags/labels.
- Prioritize important metrics for processing first.
Alternative: Facebook's Gorilla — in-memory TSDB designed to remain highly available for writes without intermediate queue.
Where aggregations can happen
- Collection agent (client-side): Simple aggregation (e.g., counter per minute).
- Ingestion pipeline (pre-write): Stream processing (Flink). Reduces write volume significantly. Loses raw data precision. Late-arriving events challenging.
- Query side (post-write): No data loss. Slower (computed at query time against full dataset).
Query service
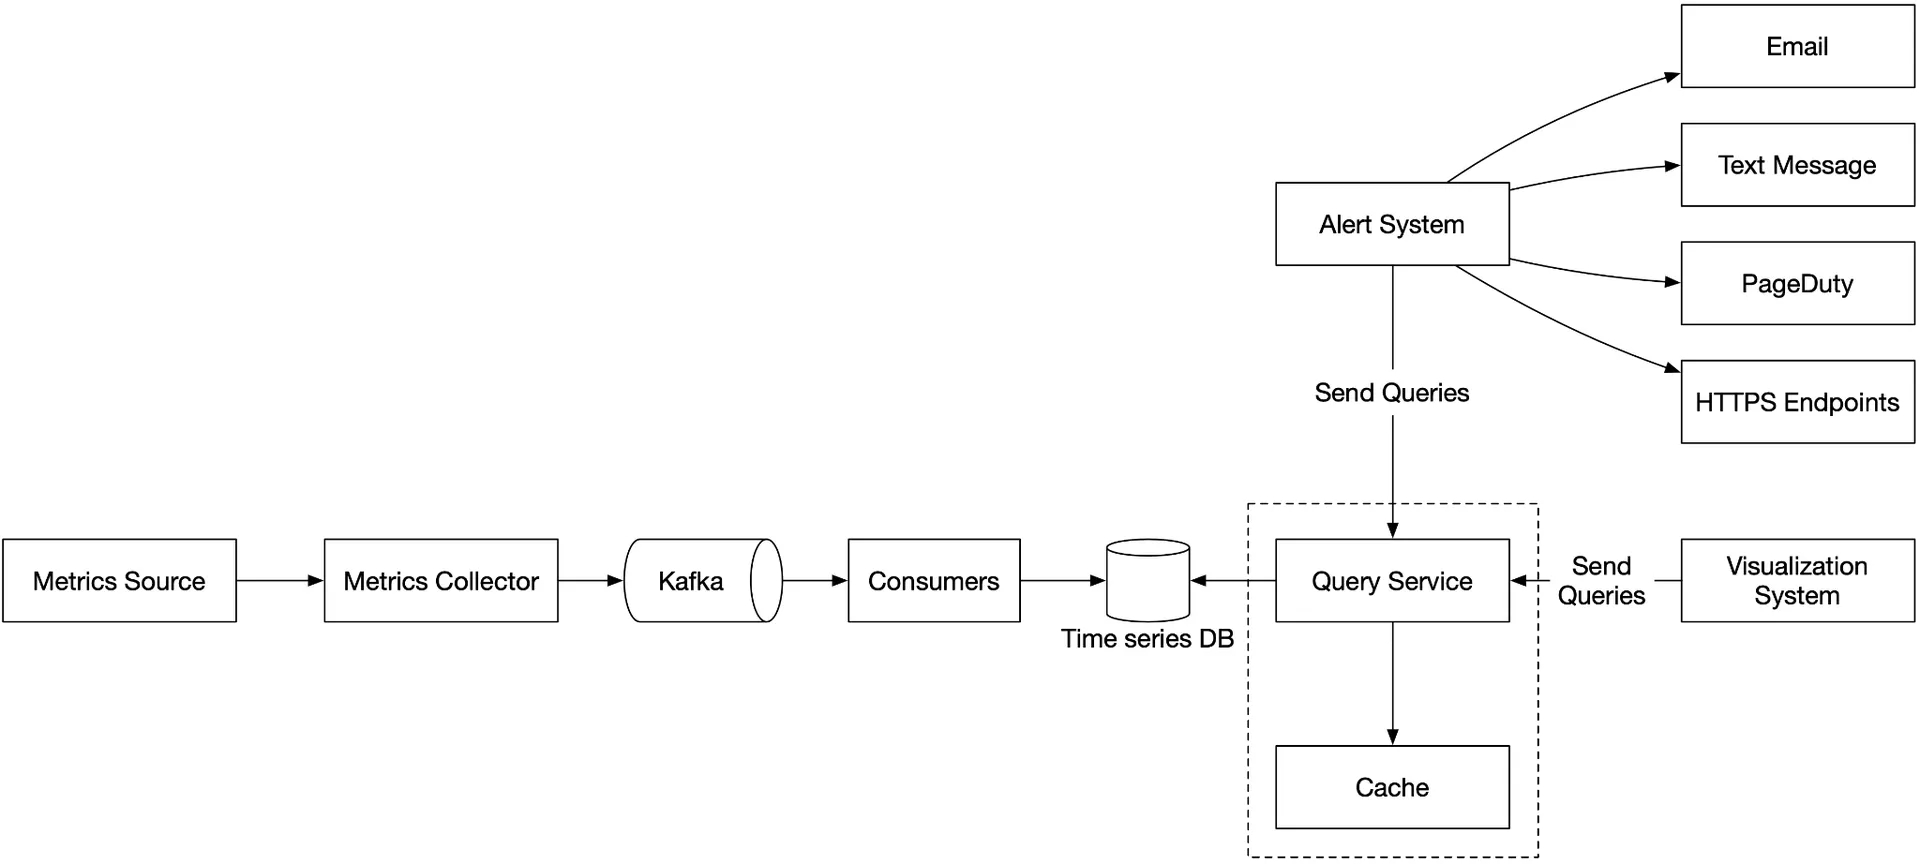
Cluster of query servers between visualization/alert systems and time-series DB. Decouples clients from storage. Cache layer for query results. Caveat: Most industrial visualization/alert systems have strong plugins for popular TSDBs — query service may be unnecessary.
Time-series database query language
SQL is painful for time-series (exponential moving average requires nested subqueries). InfluxDB's Flux is simpler:
from(db:"telegraf")
  |> range(start:-1h)
  |> filter(fn: (r) => r._measurement == "foo")
  |> exponentialMovingAverage(size:-10s)
Storage layer
85% of queries target data from the last 26 hours (Facebook research). Good TSDB harnesses this property.
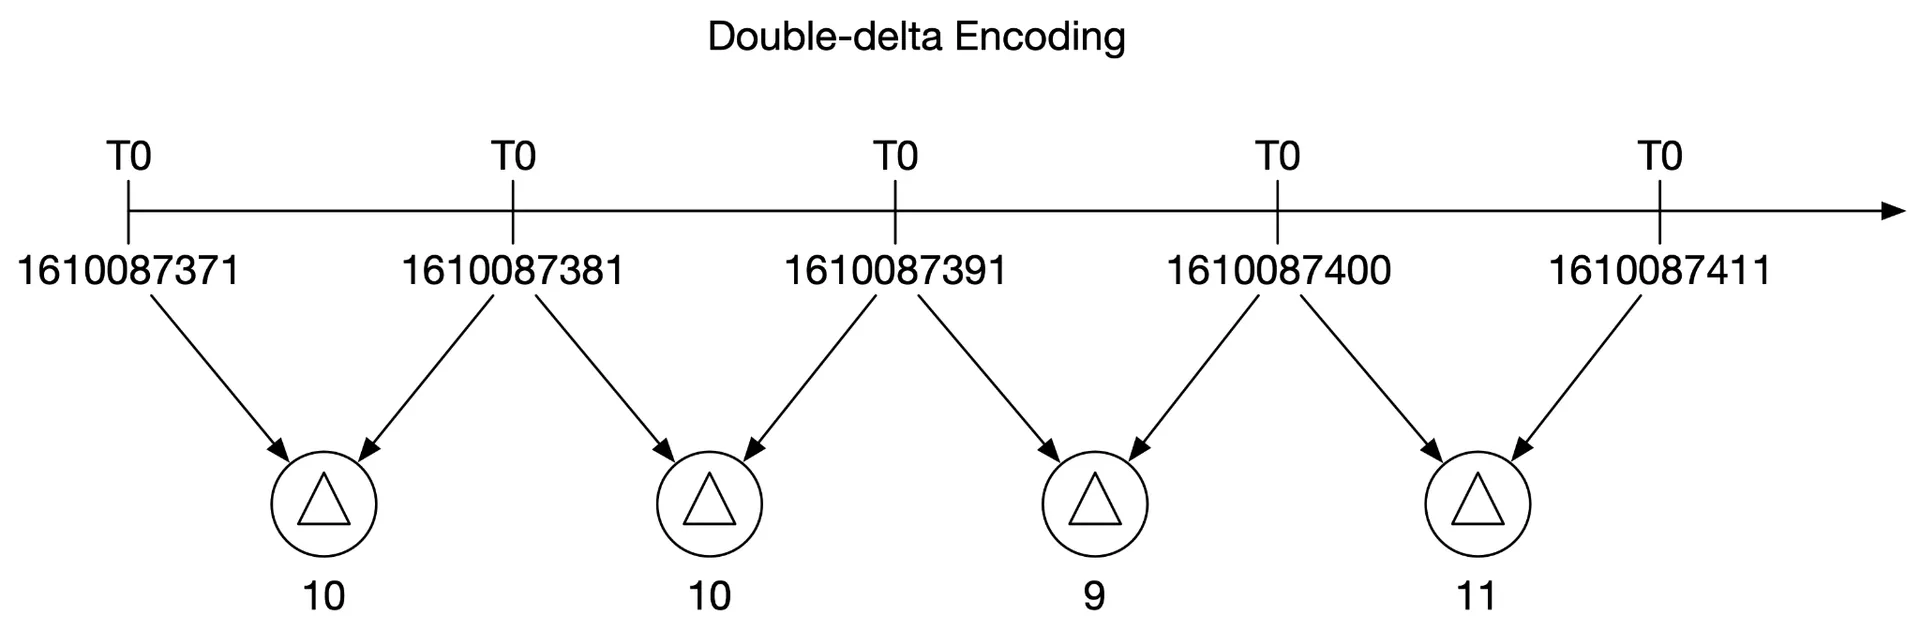
Space optimization
Data encoding/compression: Built into good TSDBs. Store deltas instead of absolute values. Example: 1610087371, 10, 10, 9, 11 (base + deltas) instead of full timestamps.
Downsampling: Convert high-res → low-res over time. Example rules:
- 7 days: no sampling
- 30 days: 1-minute resolution
- 1 year: 1-hour resolution
10s → 30s rollup: avg 3 consecutive values.
Cold storage: Rarely-used inactive data at much lower cost.
Alert system
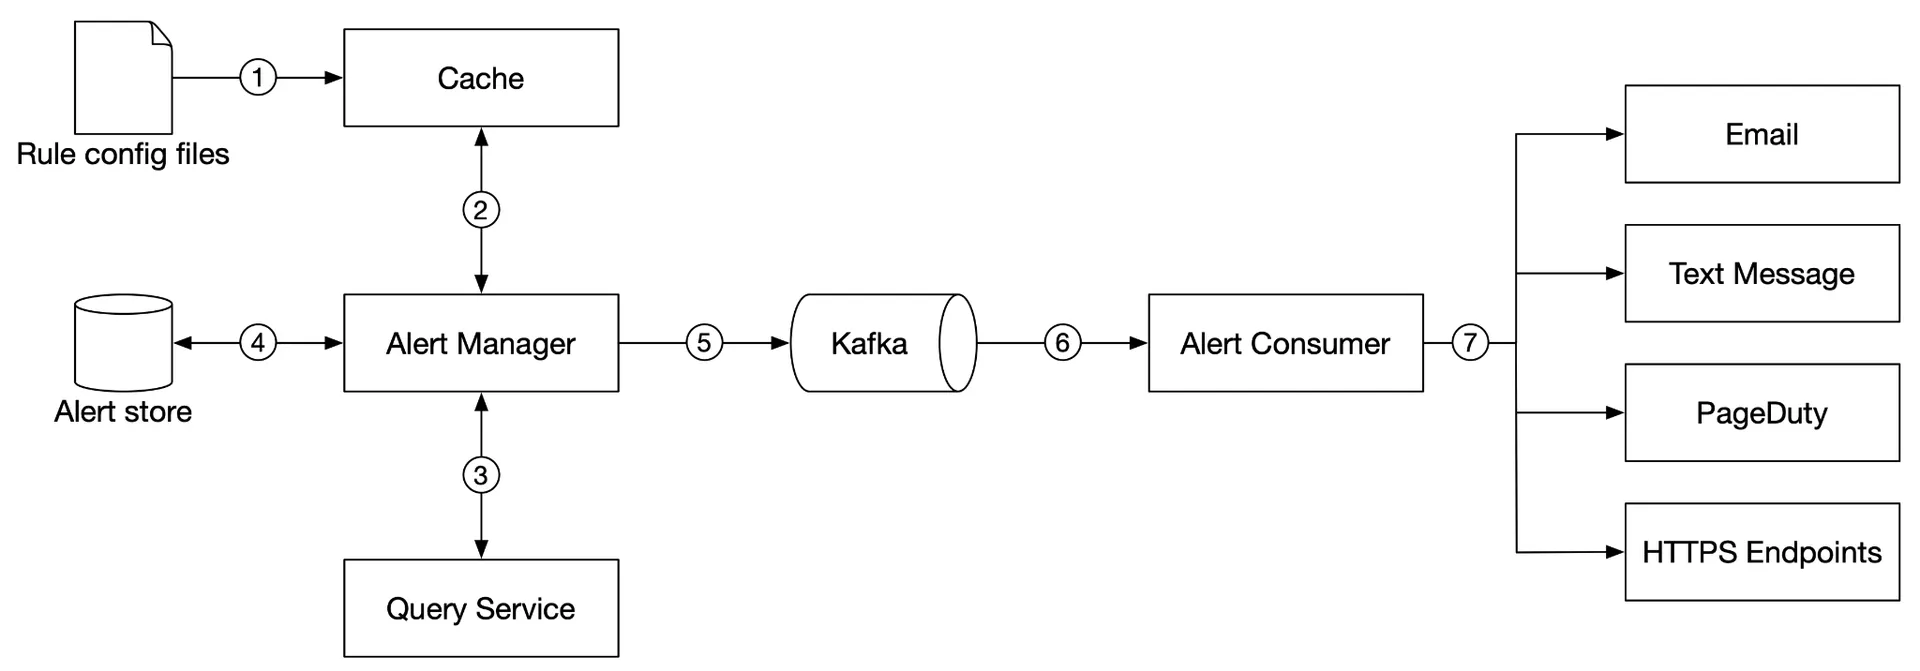
- Alert rules (YAML) loaded into cache.
- Alert manager fetches config from cache.
- Alert manager calls query service at intervals. If threshold violated → creates alert event.
- Alert store (Cassandra KV) tracks alert states (inactive, pending, firing, resolved). Ensures at-least-once notification.
- Eligible alerts → Kafka.
- Alert consumers pull from Kafka.
- Consumers send notifications (email, SMS, PagerDuty, webhook).
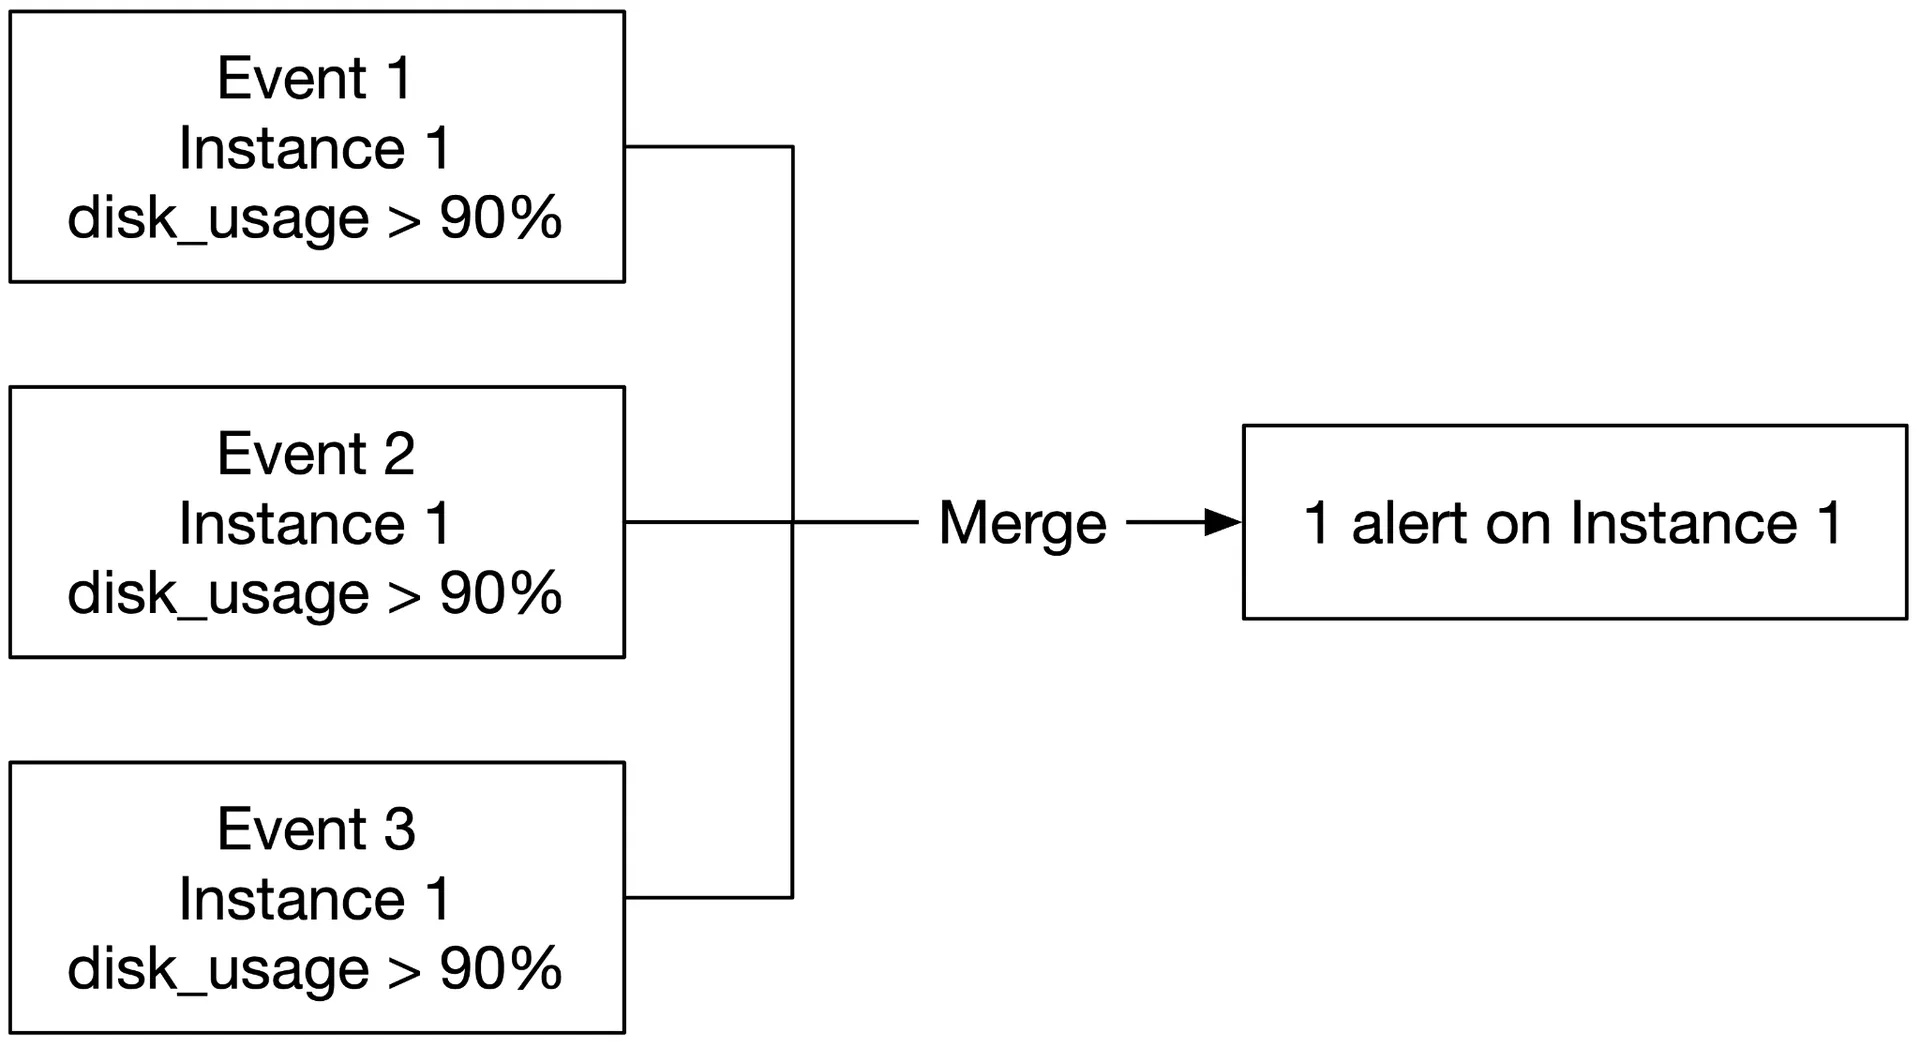
Alert manager also handles: filter/merge/dedupe alerts, access control, retry.
Build vs buy: Off-the-shelf alert systems integrate well with popular TSDBs and notification channels. Building your own is hard to justify.
Visualization system
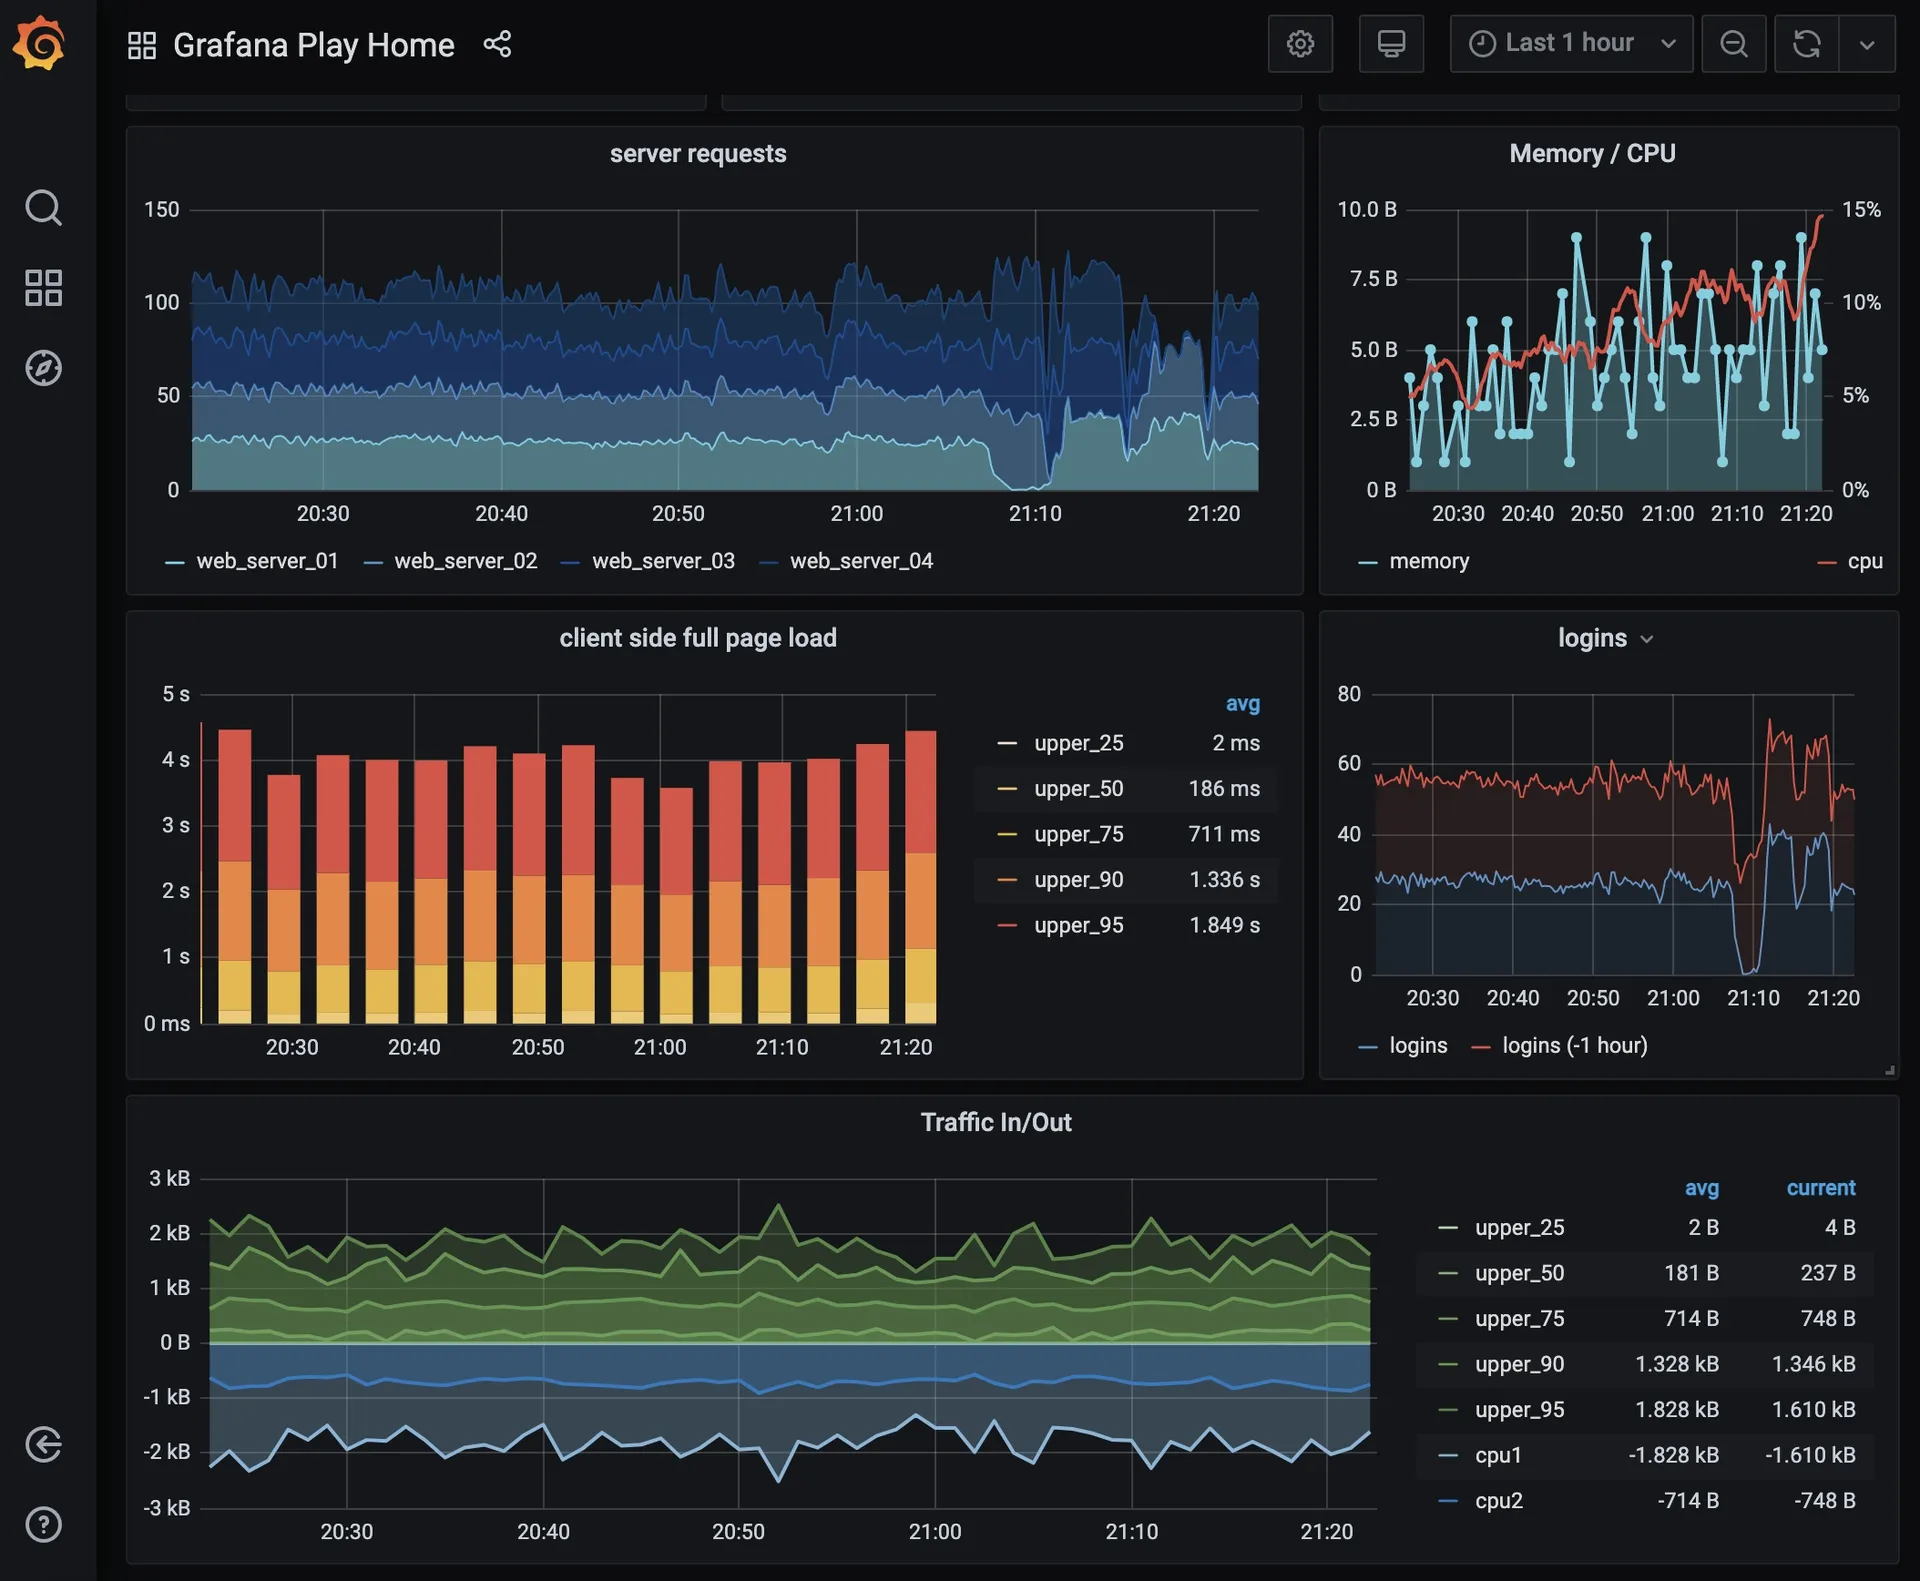
High-quality visualization is hard to build. Use off-the-shelf (e.g., Grafana) — integrates with many TSDBs.
Final design
Step 4 - Wrap Up
Key topics: pull vs push collection models, Kafka for scaling the pipeline, choosing the right time-series database, downsampling for space efficiency, build vs buy for alerting/visualization. Final design integrates all components through Kafka decoupling.