Ad Click Event Aggregation
7 min readDesign an ad click event aggregation system at Facebook/Google scale. Ad click aggregation measures advertising effectiveness — impacts billing, campaign budgets, bidding strategies. Key metrics: CTR (click-through rate), CVR (conversion rate).
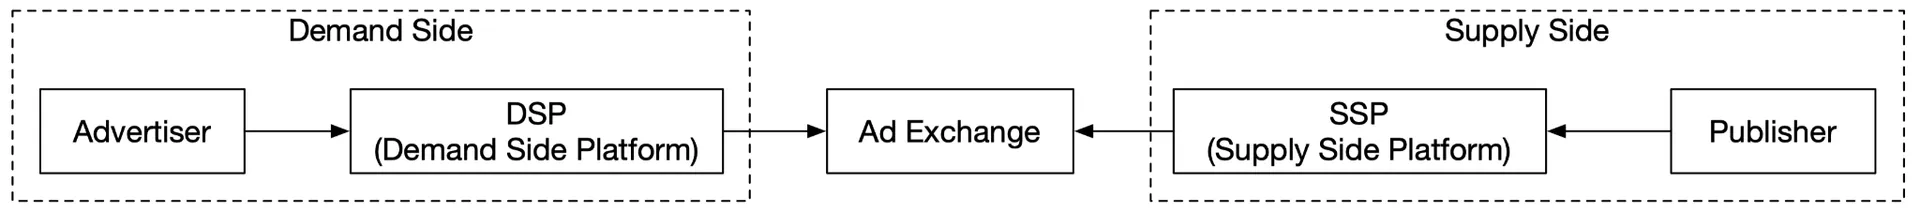
RTB (Real-Time Bidding): Core process where digital ad inventory is bought/sold in <1 second. RTB latency is sub-second; aggregation latency can be minutes.
Step 1 - Understand the Problem and Establish Design Scope
Functional requirements
- Aggregate click count for a given
ad_idin the last M minutes. - Return top 100 most clicked ads in the past 1 minute (both parameters configurable). Aggregation every minute.
- Support filtering by
ip,user_id, orcountry. - Input: log files on different servers. Fields:
ad_id,click_timestamp,user_id,ip,country. - Handle: late-arriving events, duplicated events, system recovery.
Non-functional requirements
- Correctness critical (used for billing).
- Handle delayed/duplicate events.
- Robust against partial failures.
- End-to-end latency: a few minutes max.
Back-of-the-envelope estimation
- 1B DAU × 1 ad click/user/day = 1B ad click events/day.
- Ad click QPS = 10⁹ / 10⁵ = ~10,000 (avg). Peak = 50,000 QPS (5×).
- Storage: 0.1KB/event × 1B = 100 GB/day, ~3 TB/month.
- 2M total ads. 30% YoY growth → doubles every ~3 years.
Step 2 - Propose High-Level Design and Get Buy-In
Query API design
Clients are dashboard users (data scientists, product managers, advertisers).
API 1: Aggregate click count
| API | Detail |
|---|---|
| GET /ads/{:ad_id}/aggregated_count | Return aggregated count for ad_id |
Parameters: from (start minute), to (end minute), filter (filtering strategy ID).
Response: {ad_id, count}.
API 2: Top N most clicked ads
| API | Detail |
|---|---|
| GET /ads/popular_ads | Return top N most clicked ads in last M minutes |
Parameters: count (top N), window (M minutes), filter.
Response: {ad_ids: array}.
Data model
Raw data (log files)
| ad_id | click_timestamp | user_id | ip | country |
|---|---|---|---|---|
| ad001 | 2021-01-01 00:00:01 | user1 | 207.148.22.22 | USA |
Aggregated data (per minute)
| ad_id | click_minute | count |
|---|---|---|
| ad001 | 202101010000 | 5 |
With filters (star schema):
| ad_id | click_minute | filter_id | count |
|---|---|---|---|
| ad001 | 202101010000 | 0012 | 2 |
| ad001 | 202101010000 | 0023 | 3 |
Filter table maps filter_id → {region, IP, user_id}.
Top N structure:
| Field | Type | Description |
|---|---|---|
| window_size | integer | Aggregation window (M minutes) |
| update_time_minute | timestamp | Last updated (minute granularity) |
| most_clicked_ads | array | List of ad IDs (JSON) |
Store both raw and aggregated data
| Approach | Pros | Cons |
|---|---|---|
| Raw only | Full dataset; supports filtering/recalculation | Huge storage; slow queries |
| Aggregated only | Smaller dataset; fast queries | Data loss (derived); can't recalculate |
Recommendation: store both. Raw = backup + debug + recalculation source (move old to cold storage). Aggregated = active query data.
Database choice
Raw data: Write-heavy (10K avg QPS, 50K peak), low read volume. Cassandra or InfluxDB (optimized for write + time-range queries). Alternative: columnar formats (ORC, Parquet, AVRO) on S3 with file rotation.
Aggregated data: Read-heavy (2M ads queried every minute for dashboards) AND write-heavy (every-minute aggregation). Same DB type works for both.
High-level design
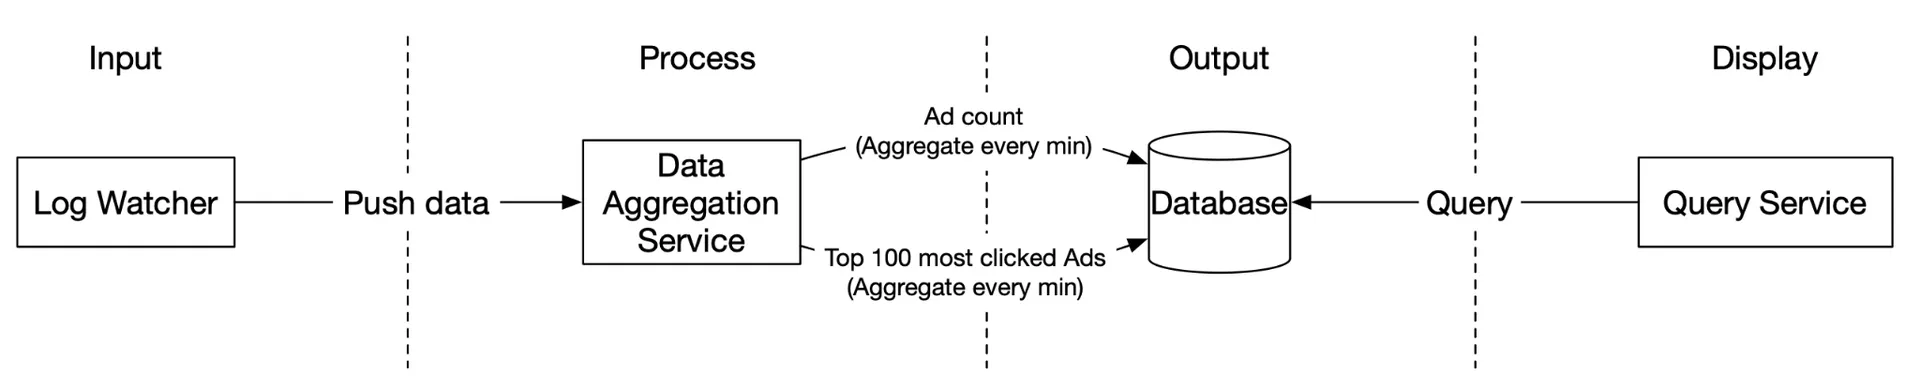
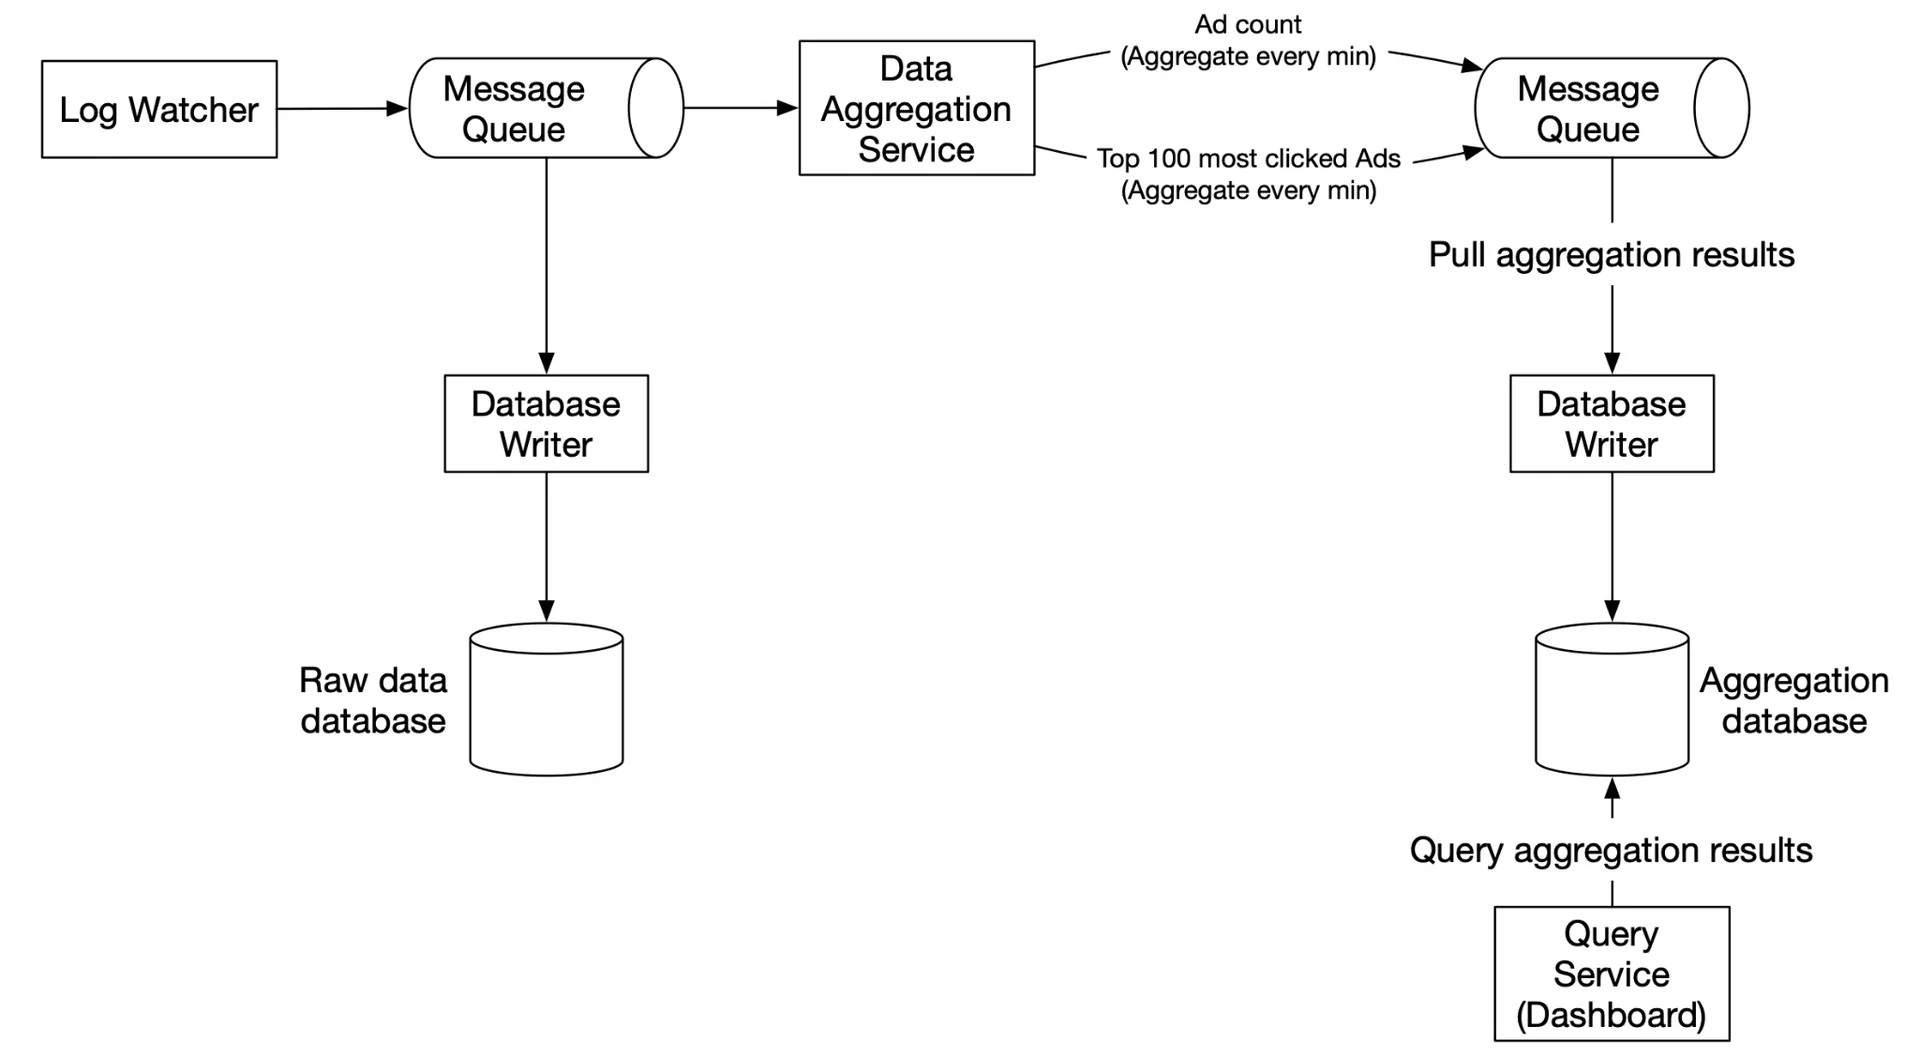
Unbounded data stream → aggregation → aggregated results. Asynchronous processing via two Kafka queues:
Message queue 1: Raw ad click events (ad_id, click_timestamp, user_id, ip, country).
Message queue 2: Two data types per minute:
- Ad click counts (ad_id, click_minute, count).
- Top N most clicked ads (update_time_minute, most_clicked_ads).
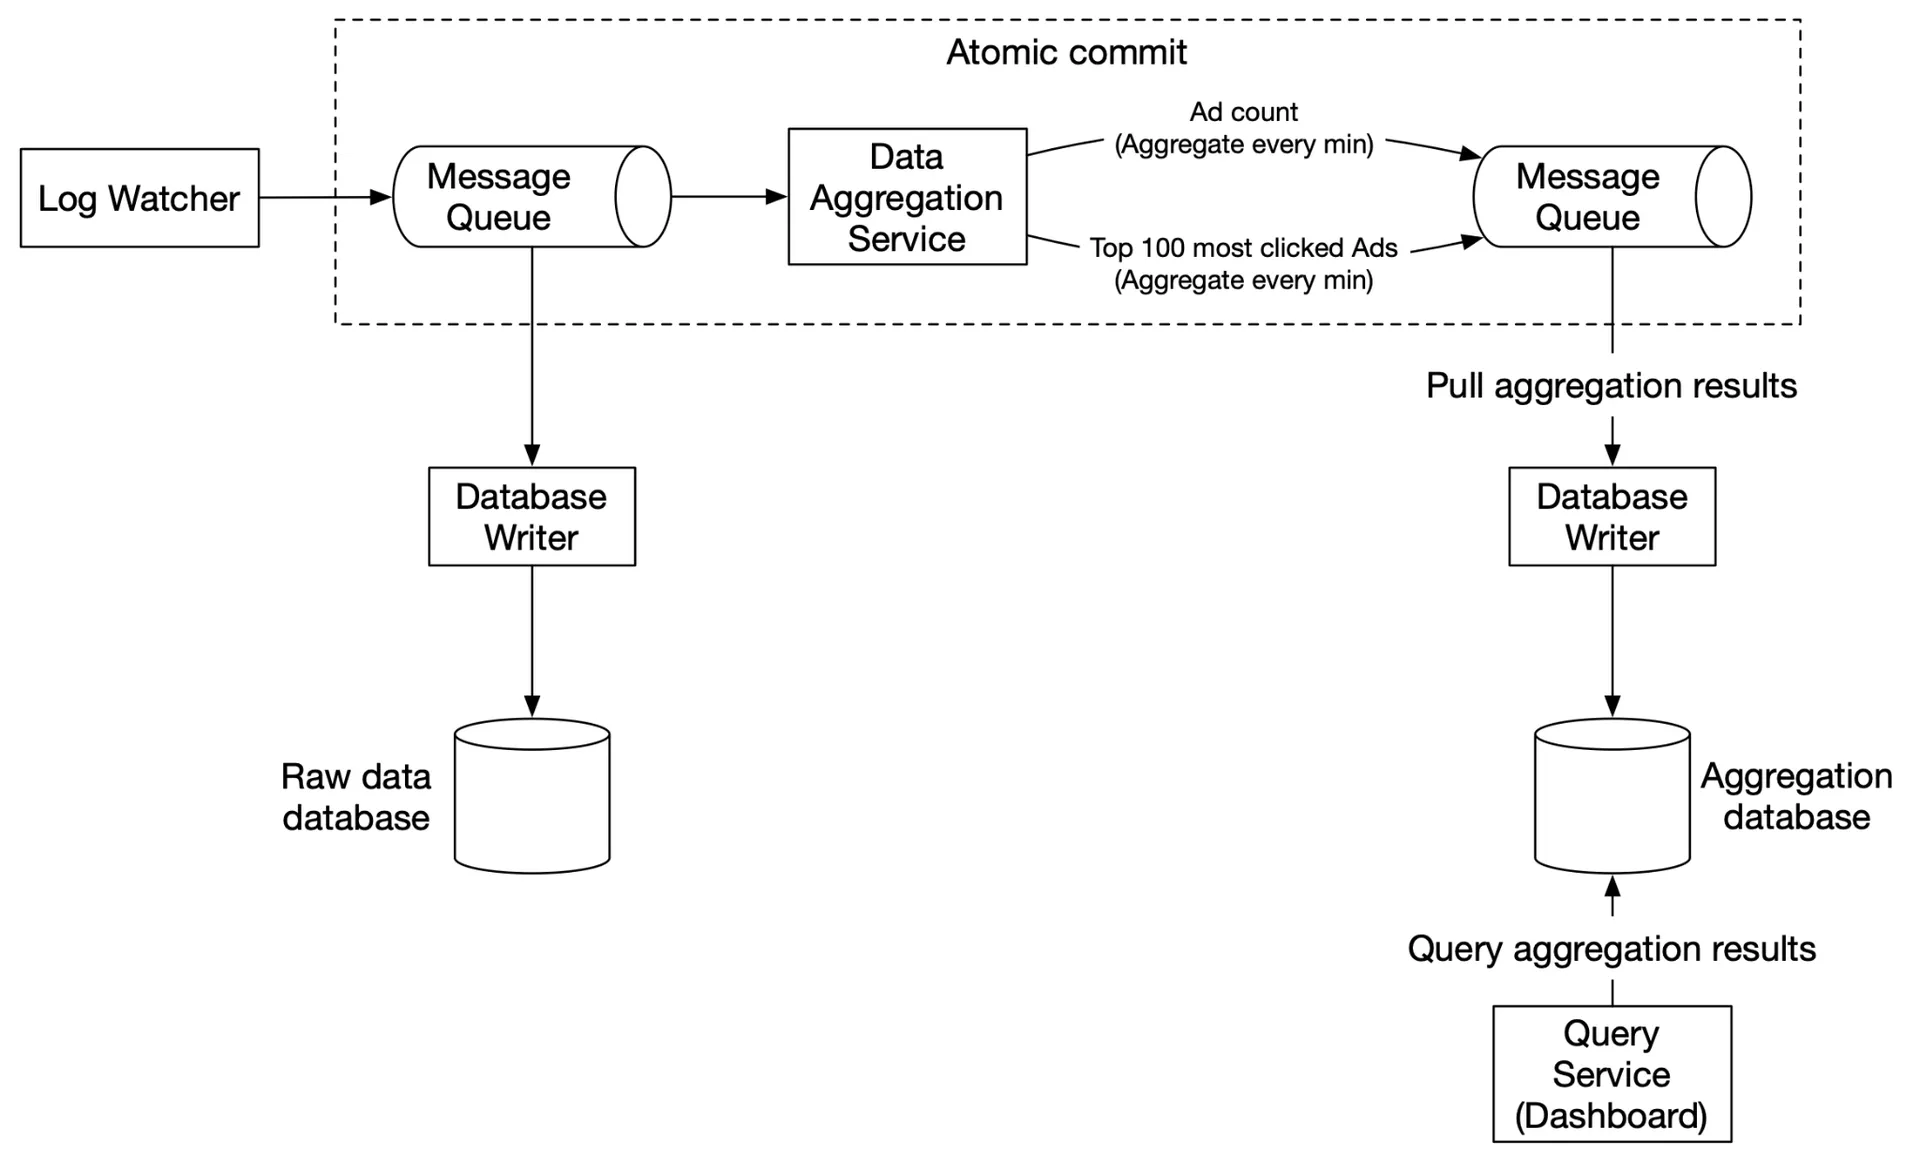
Second Kafka needed for end-to-end exactly-once semantics (atomic commit).
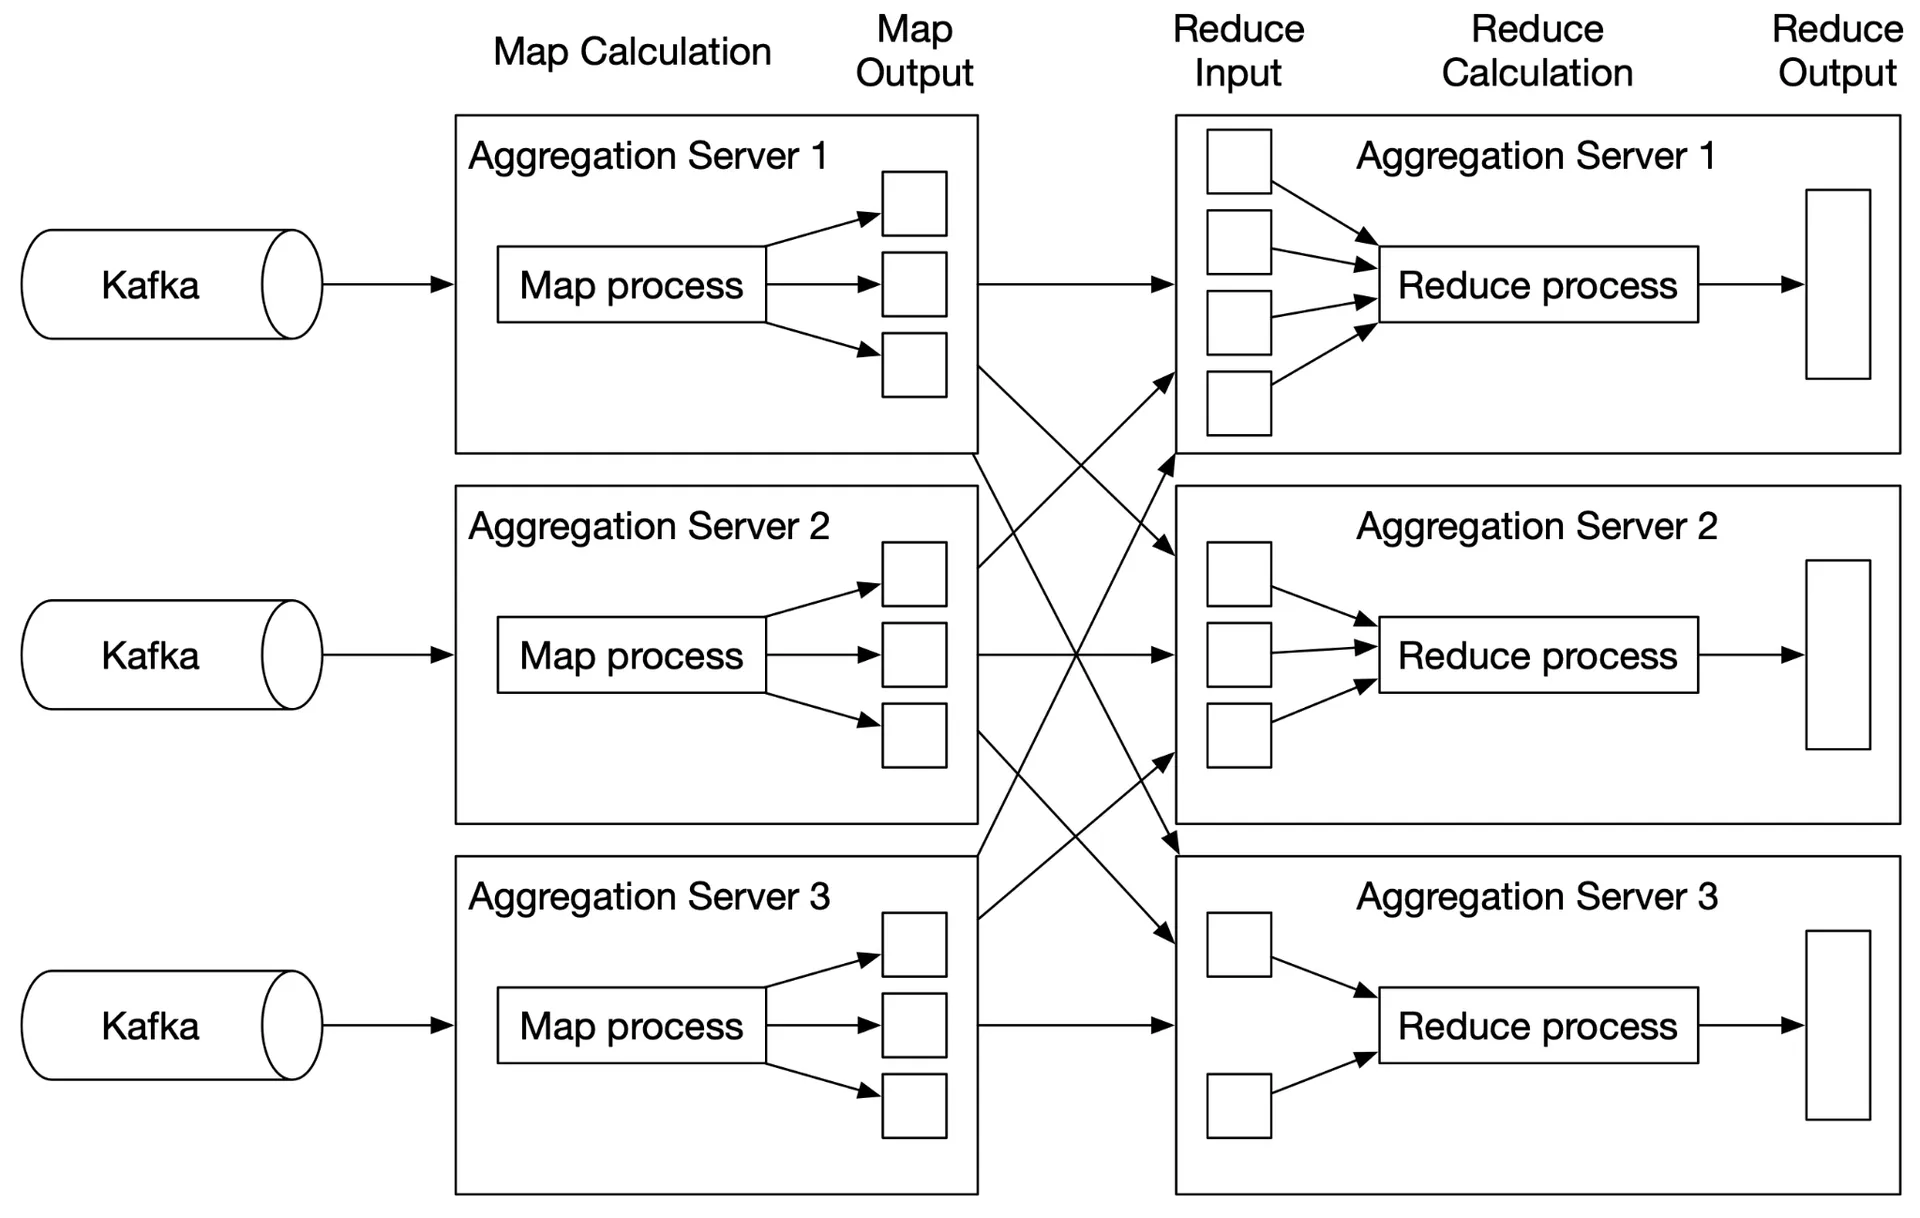
Aggregation service (MapReduce DAG)
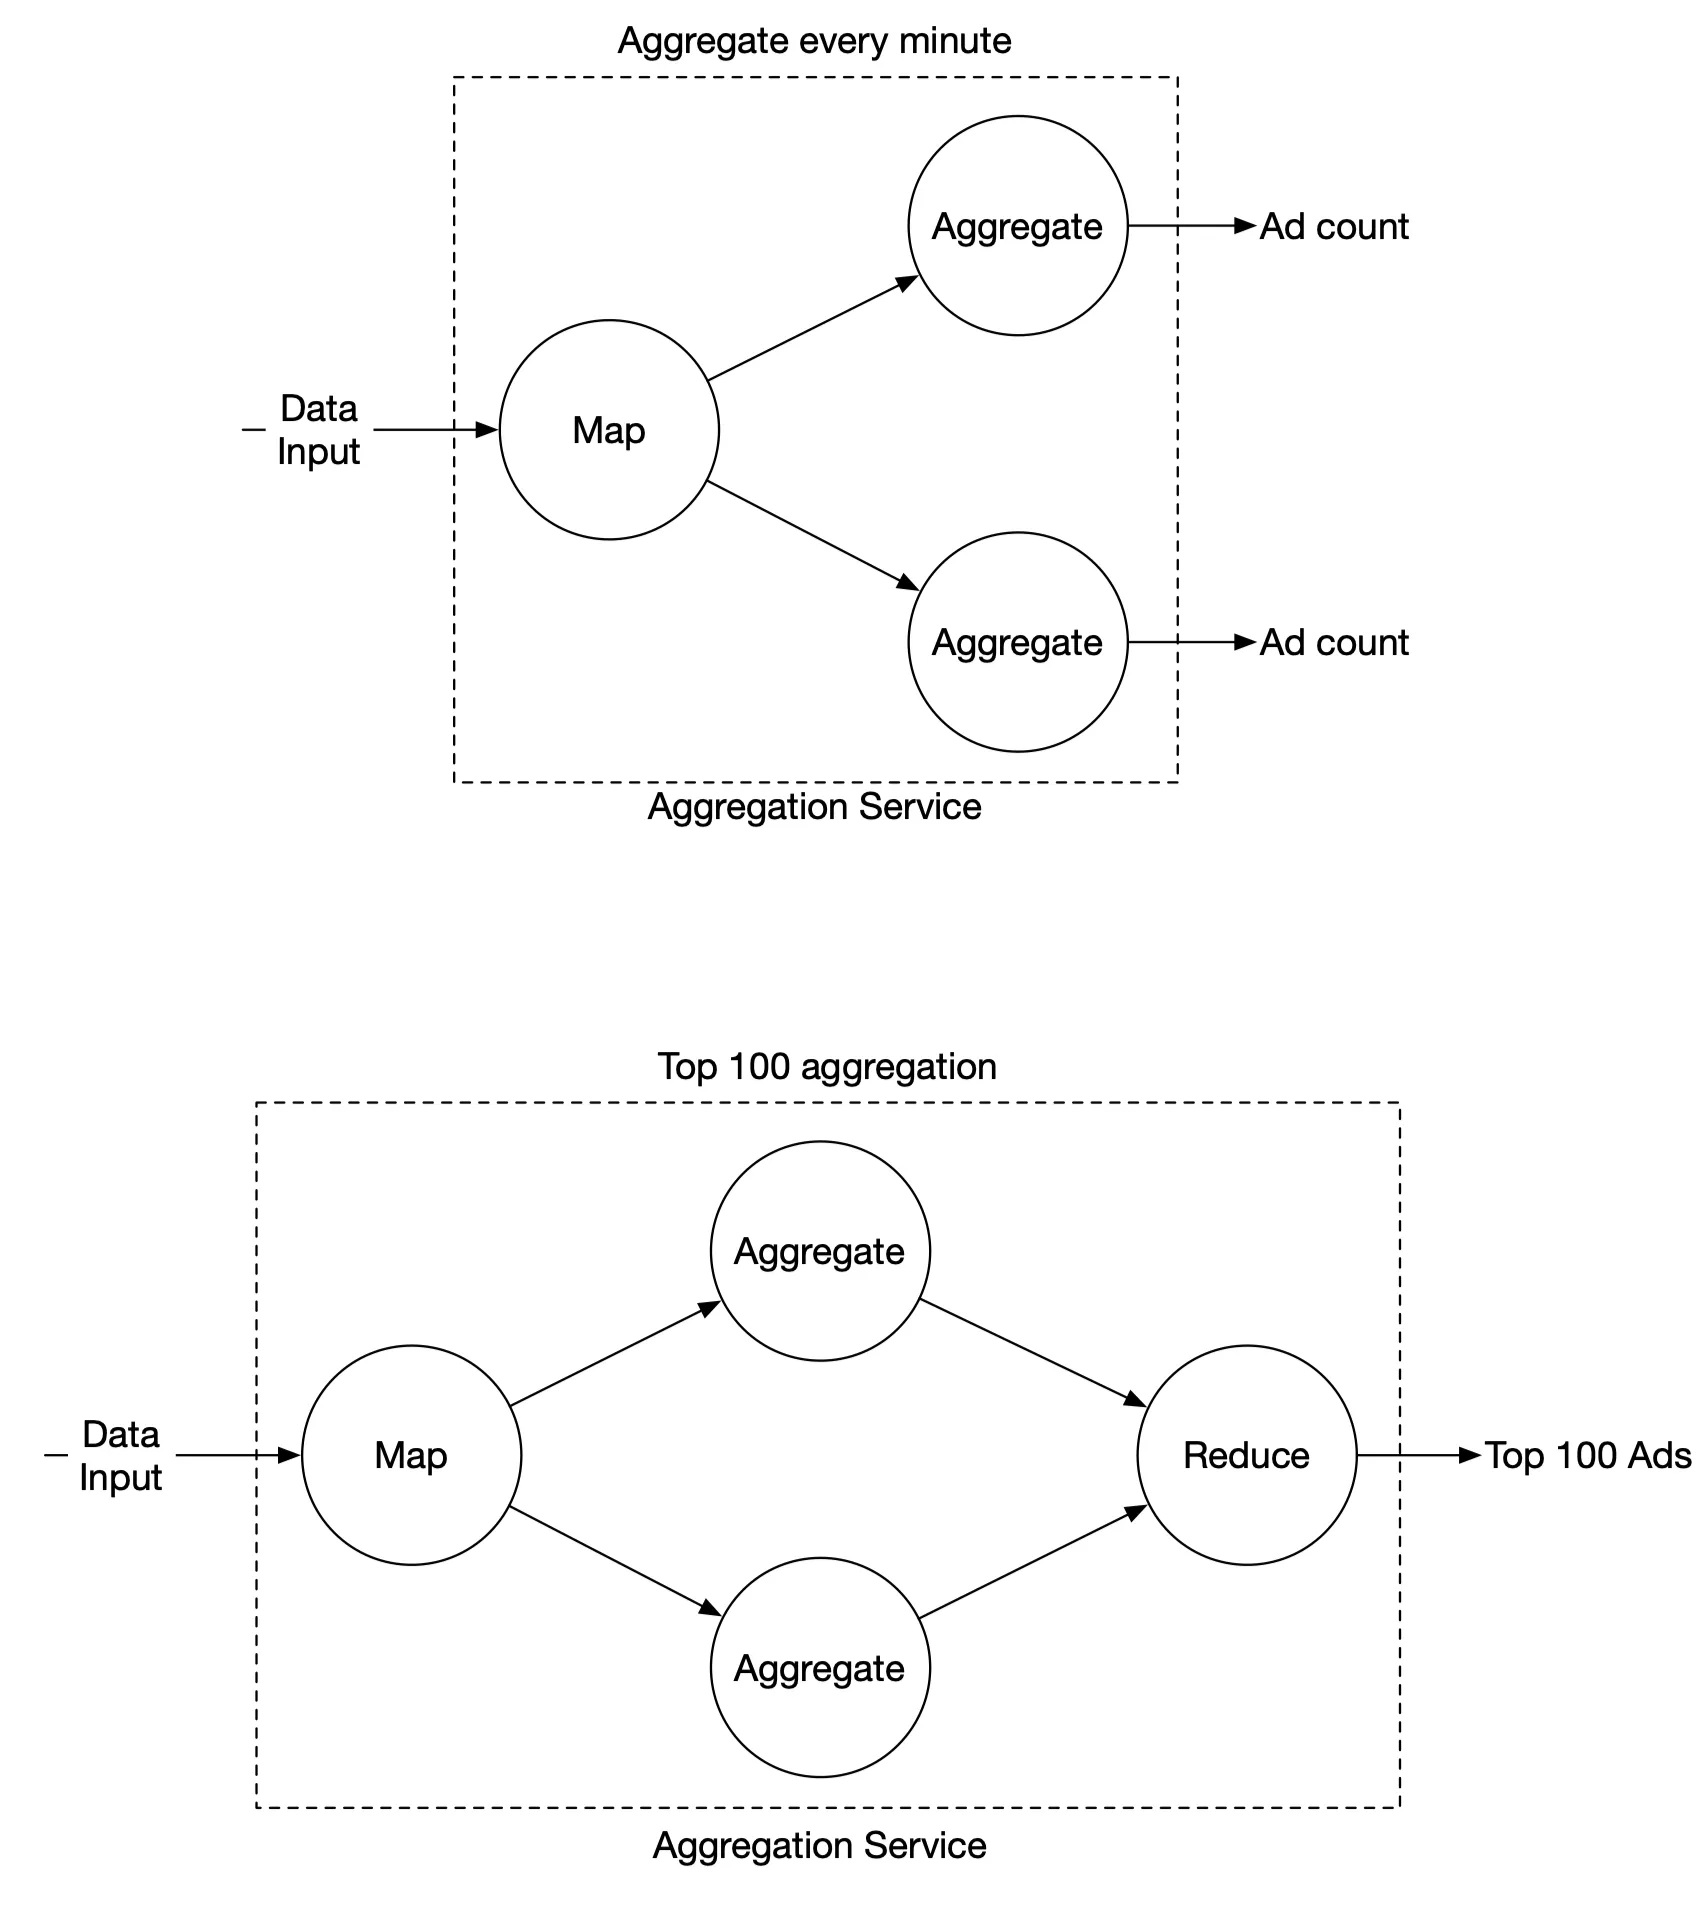
DAG model breaks system into small computing units:
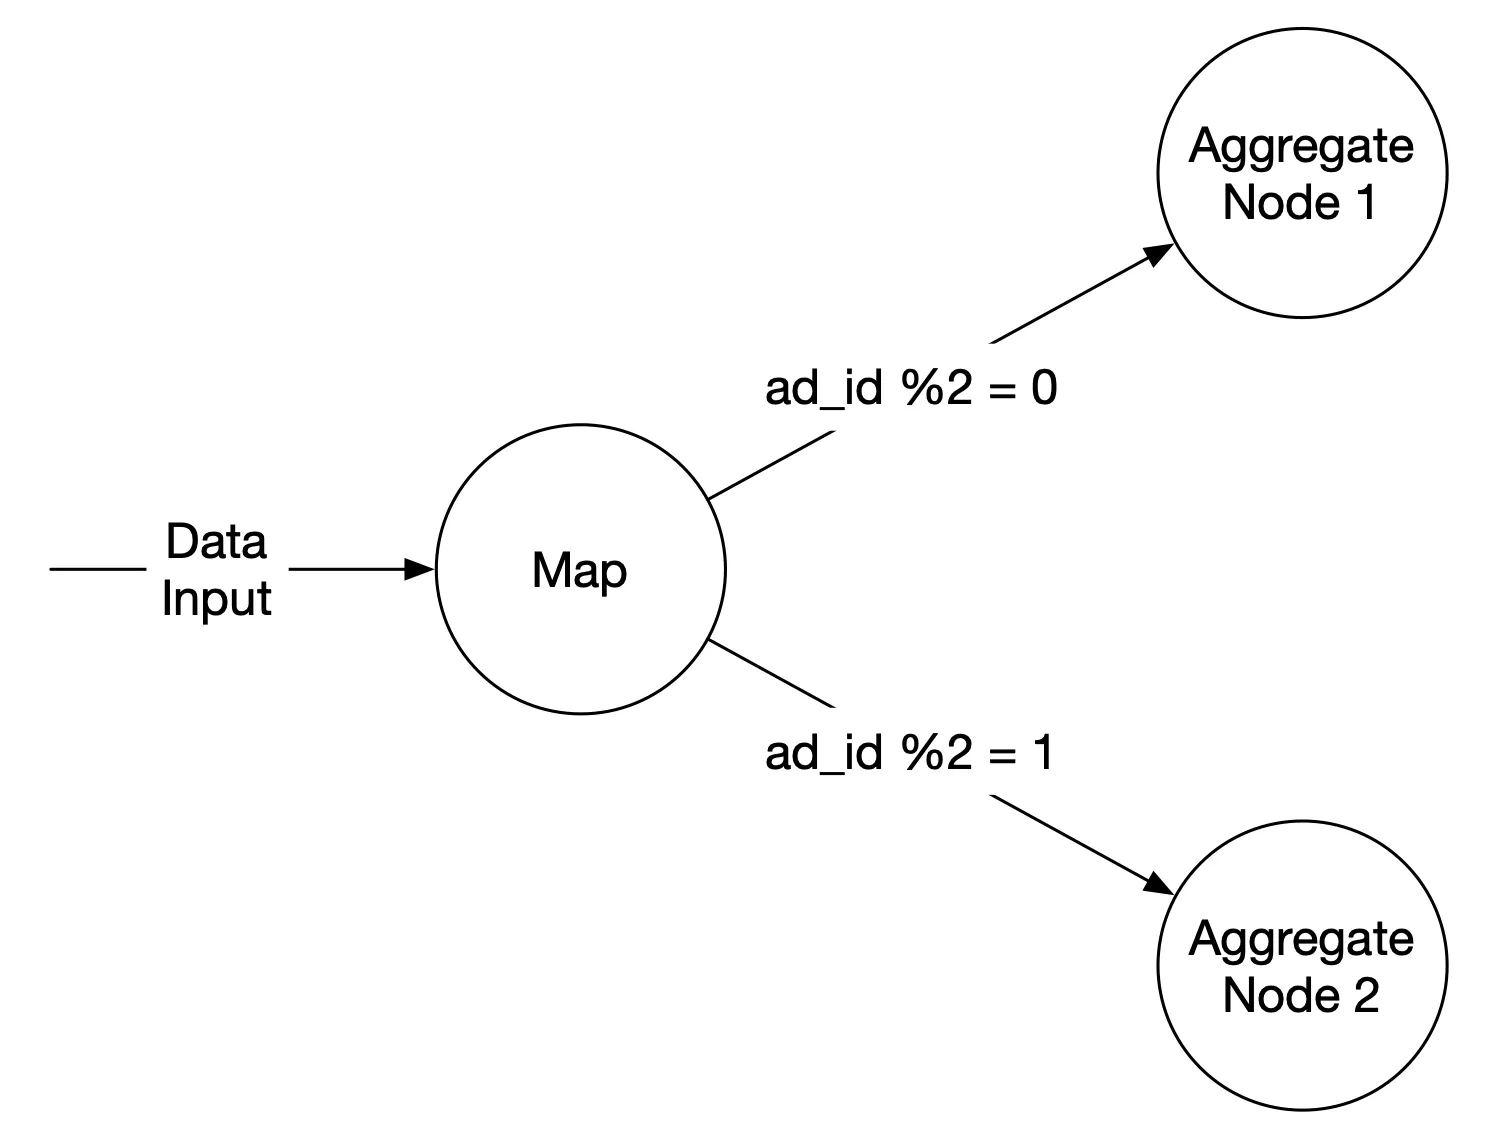
Map node: Reads from data source, filters, transforms. Routes by ad_id % N to aggregate nodes. Needed for: data cleaning/normalization, handling events of same ad_id landing in different Kafka partitions.
Aggregate node: Counts ad click events by ad_id in memory every minute.
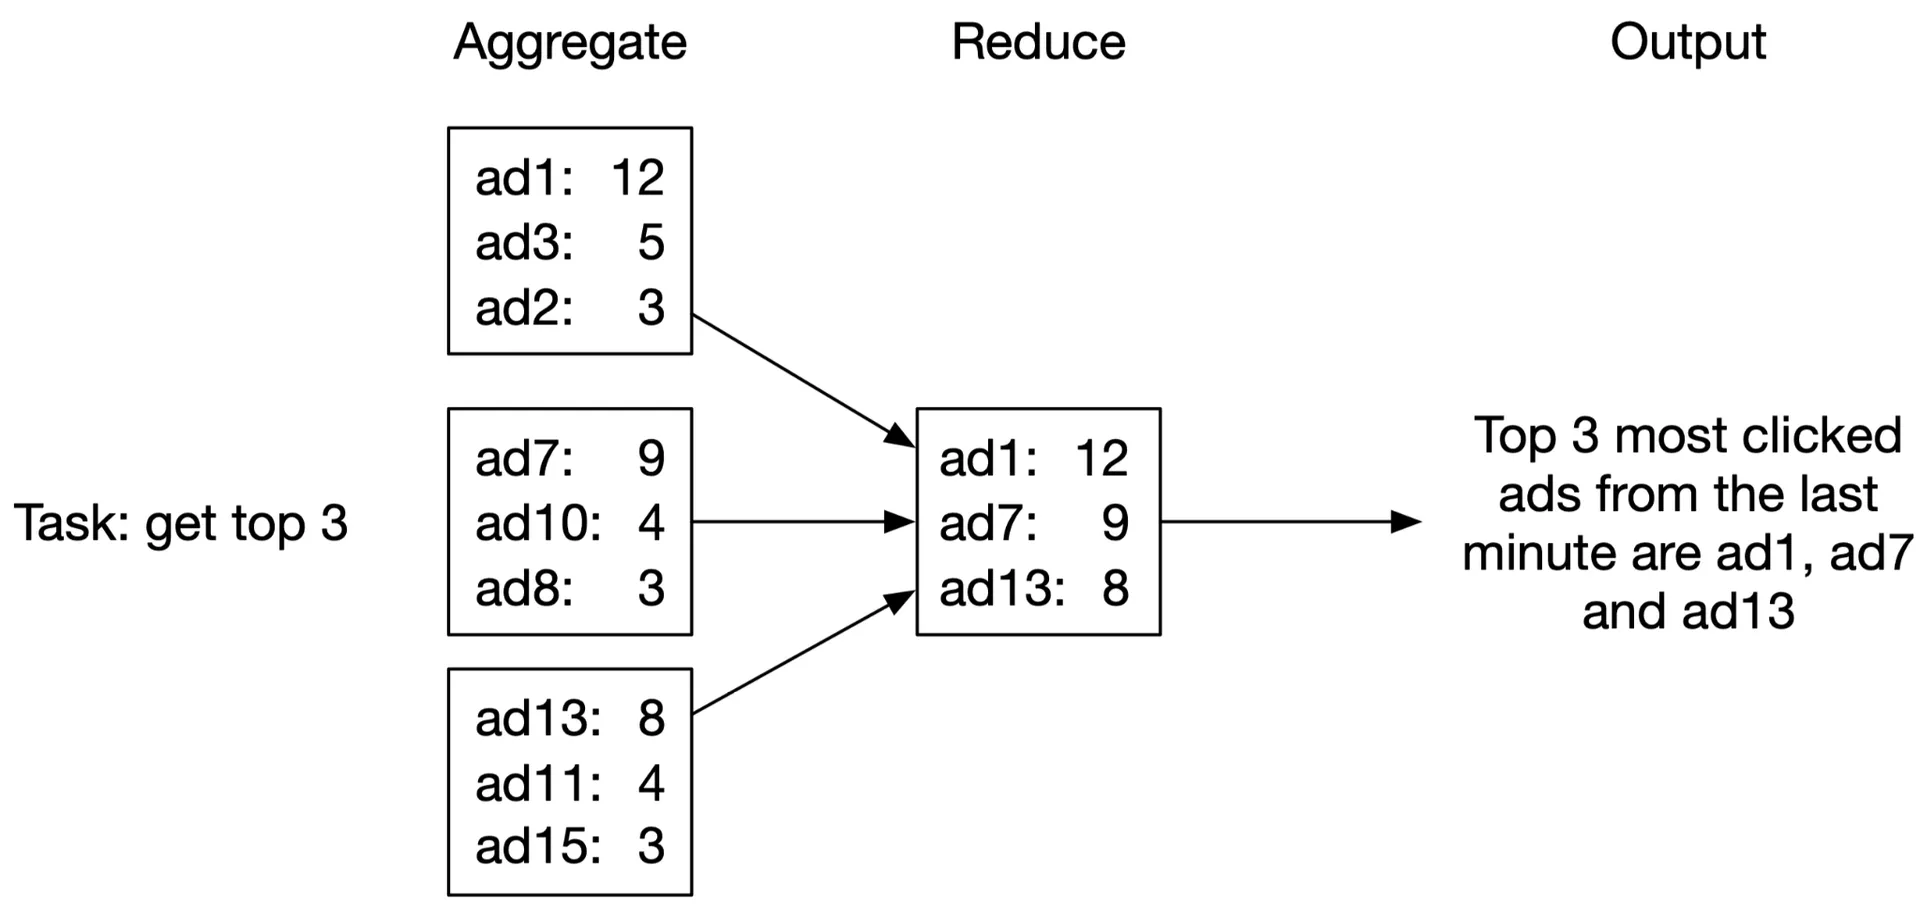
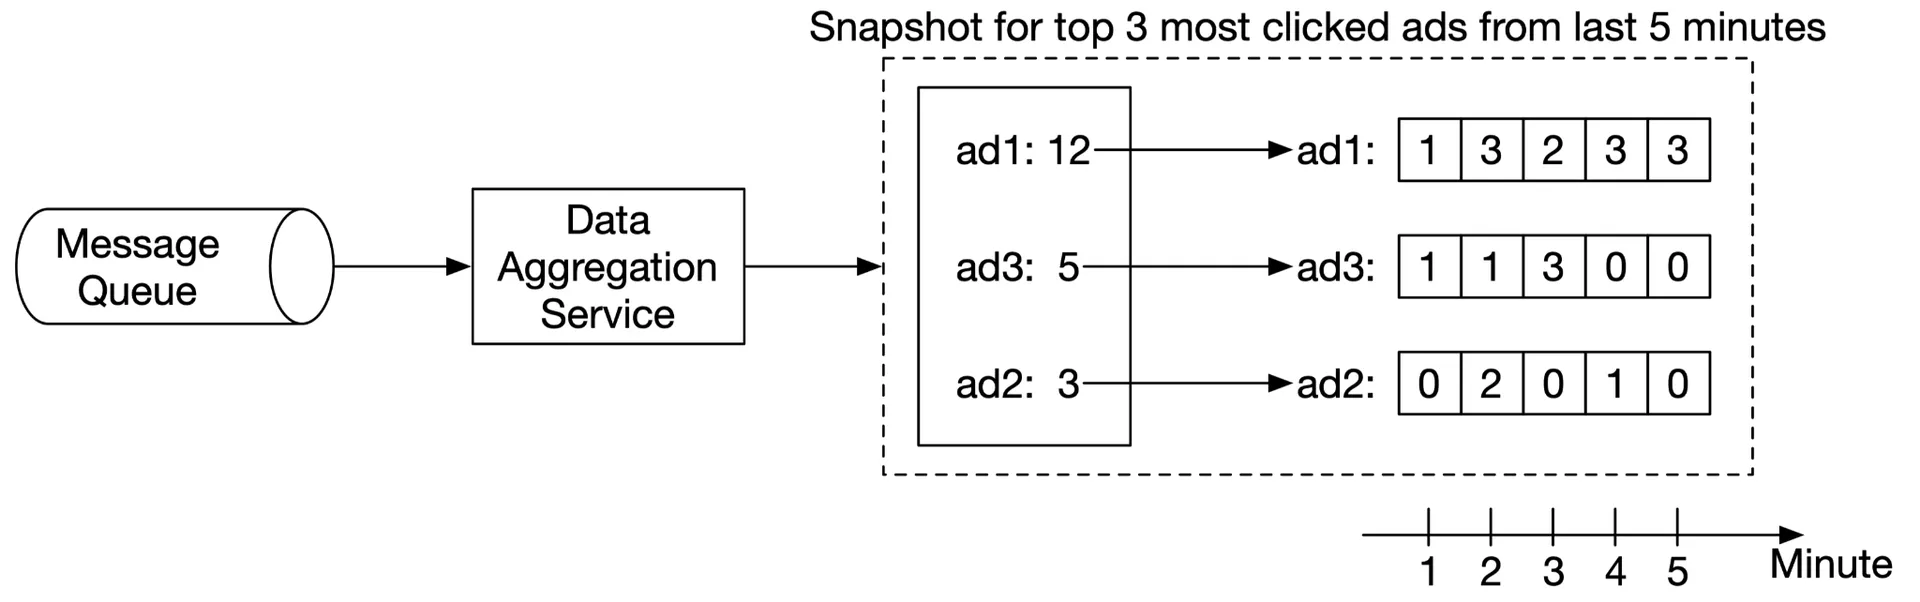
Reduce node: Reduces results from all aggregate nodes to final result. Example: 3 aggregate nodes each have top 3 → Reduce node merges to top 3 overall.
DAG = MapReduce paradigm. Intermediate data in memory; nodes communicate via TCP (different processes) or shared memory (different threads).
Use case 1: Aggregate click count
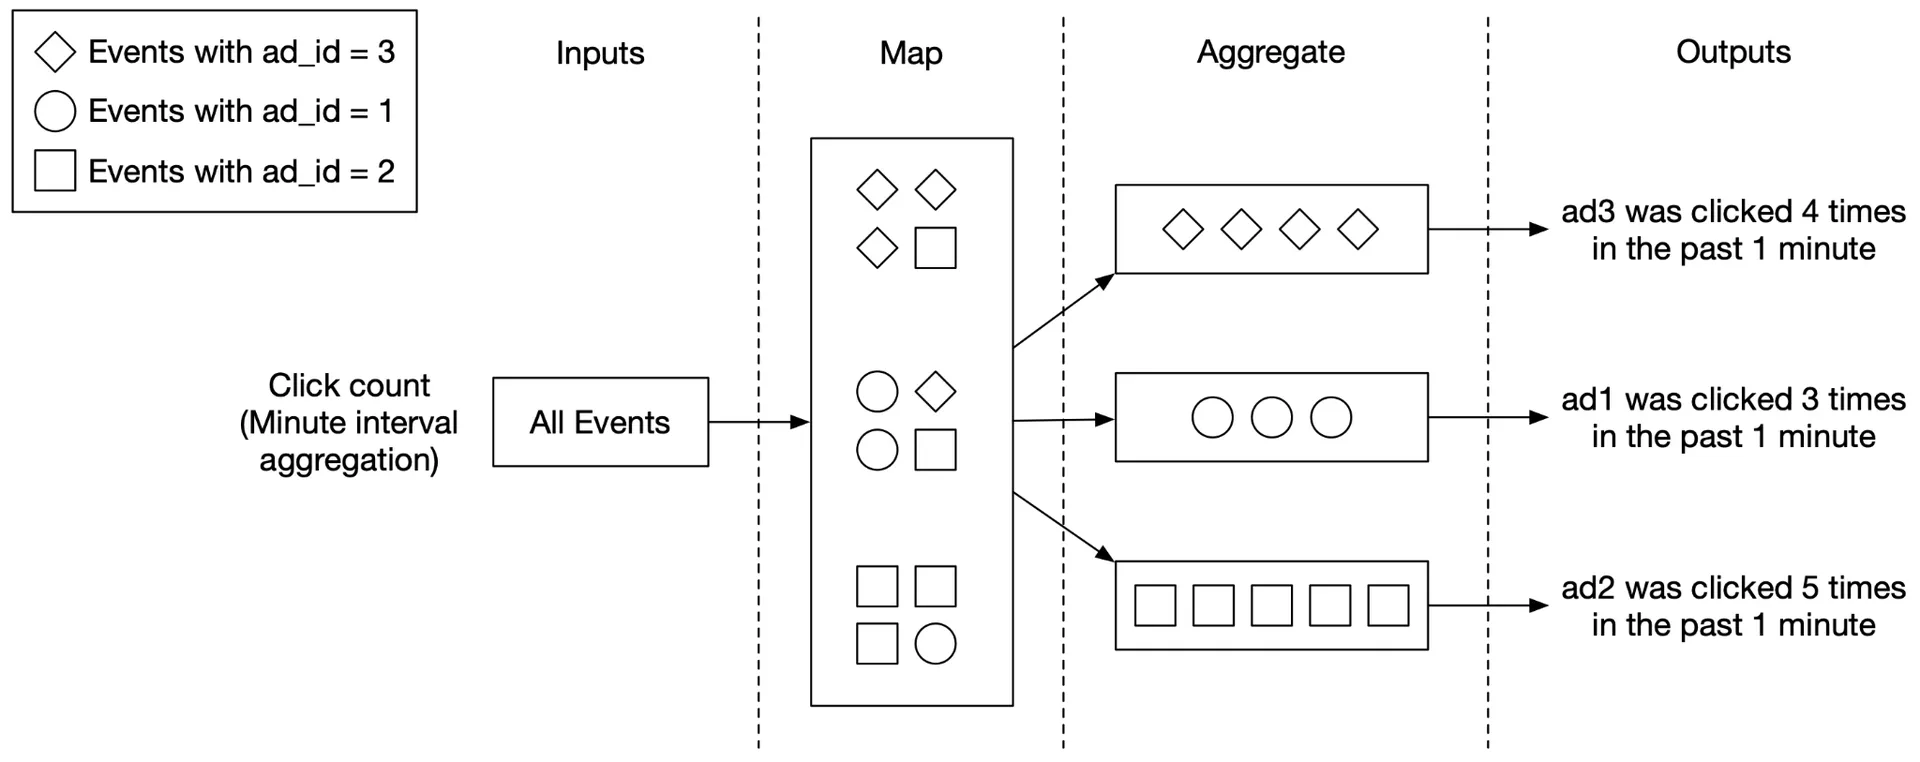
Input events partitioned by ad_id % 3 in Map nodes → aggregated by Aggregate nodes.
Use case 2: Top N most clicked ads
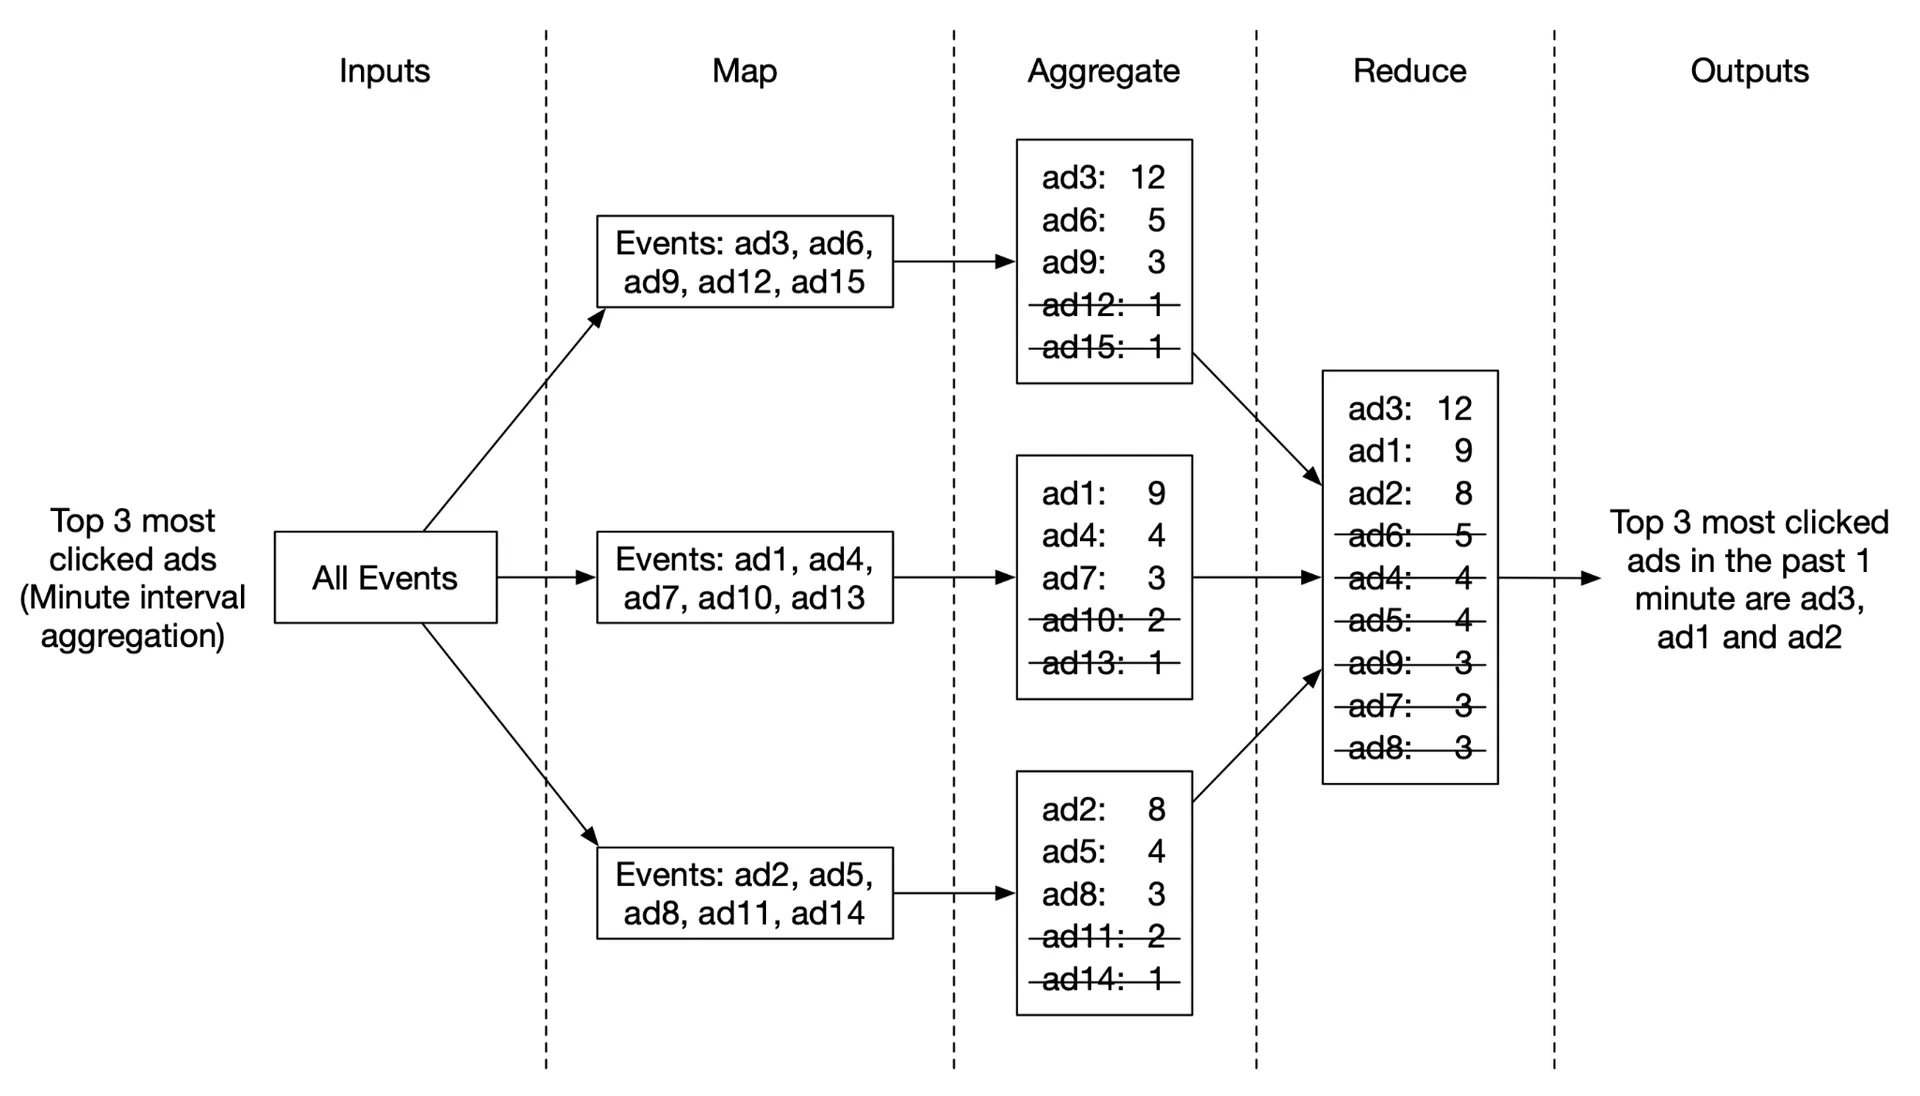
Each Aggregate node maintains a heap for efficient top-k. Reduce node merges 3N candidates → final top N.
Use case 3: Data filtering
Pre-define filtering criteria; aggregate with dimensions. Star schema: filtering fields = dimensions. Benefits: simple, reuses aggregation service, fast pre-calculated access. Limitation: many buckets/records with many filter criteria.
Step 3 - Design Deep Dive
Streaming vs batching
| Type | Responsiveness | Input | Output | Performance | Example |
|---|---|---|---|---|---|
| Online (services) | Fast response | User requests | Responses | Availability, latency | Shopping |
| Batch (offline) | No response needed | Bounded, large | Materialized views | Throughput | MapReduce |
| Streaming (near real-time) | No response needed | Unbounded streams | Materialized views | Throughput, latency | Flink |
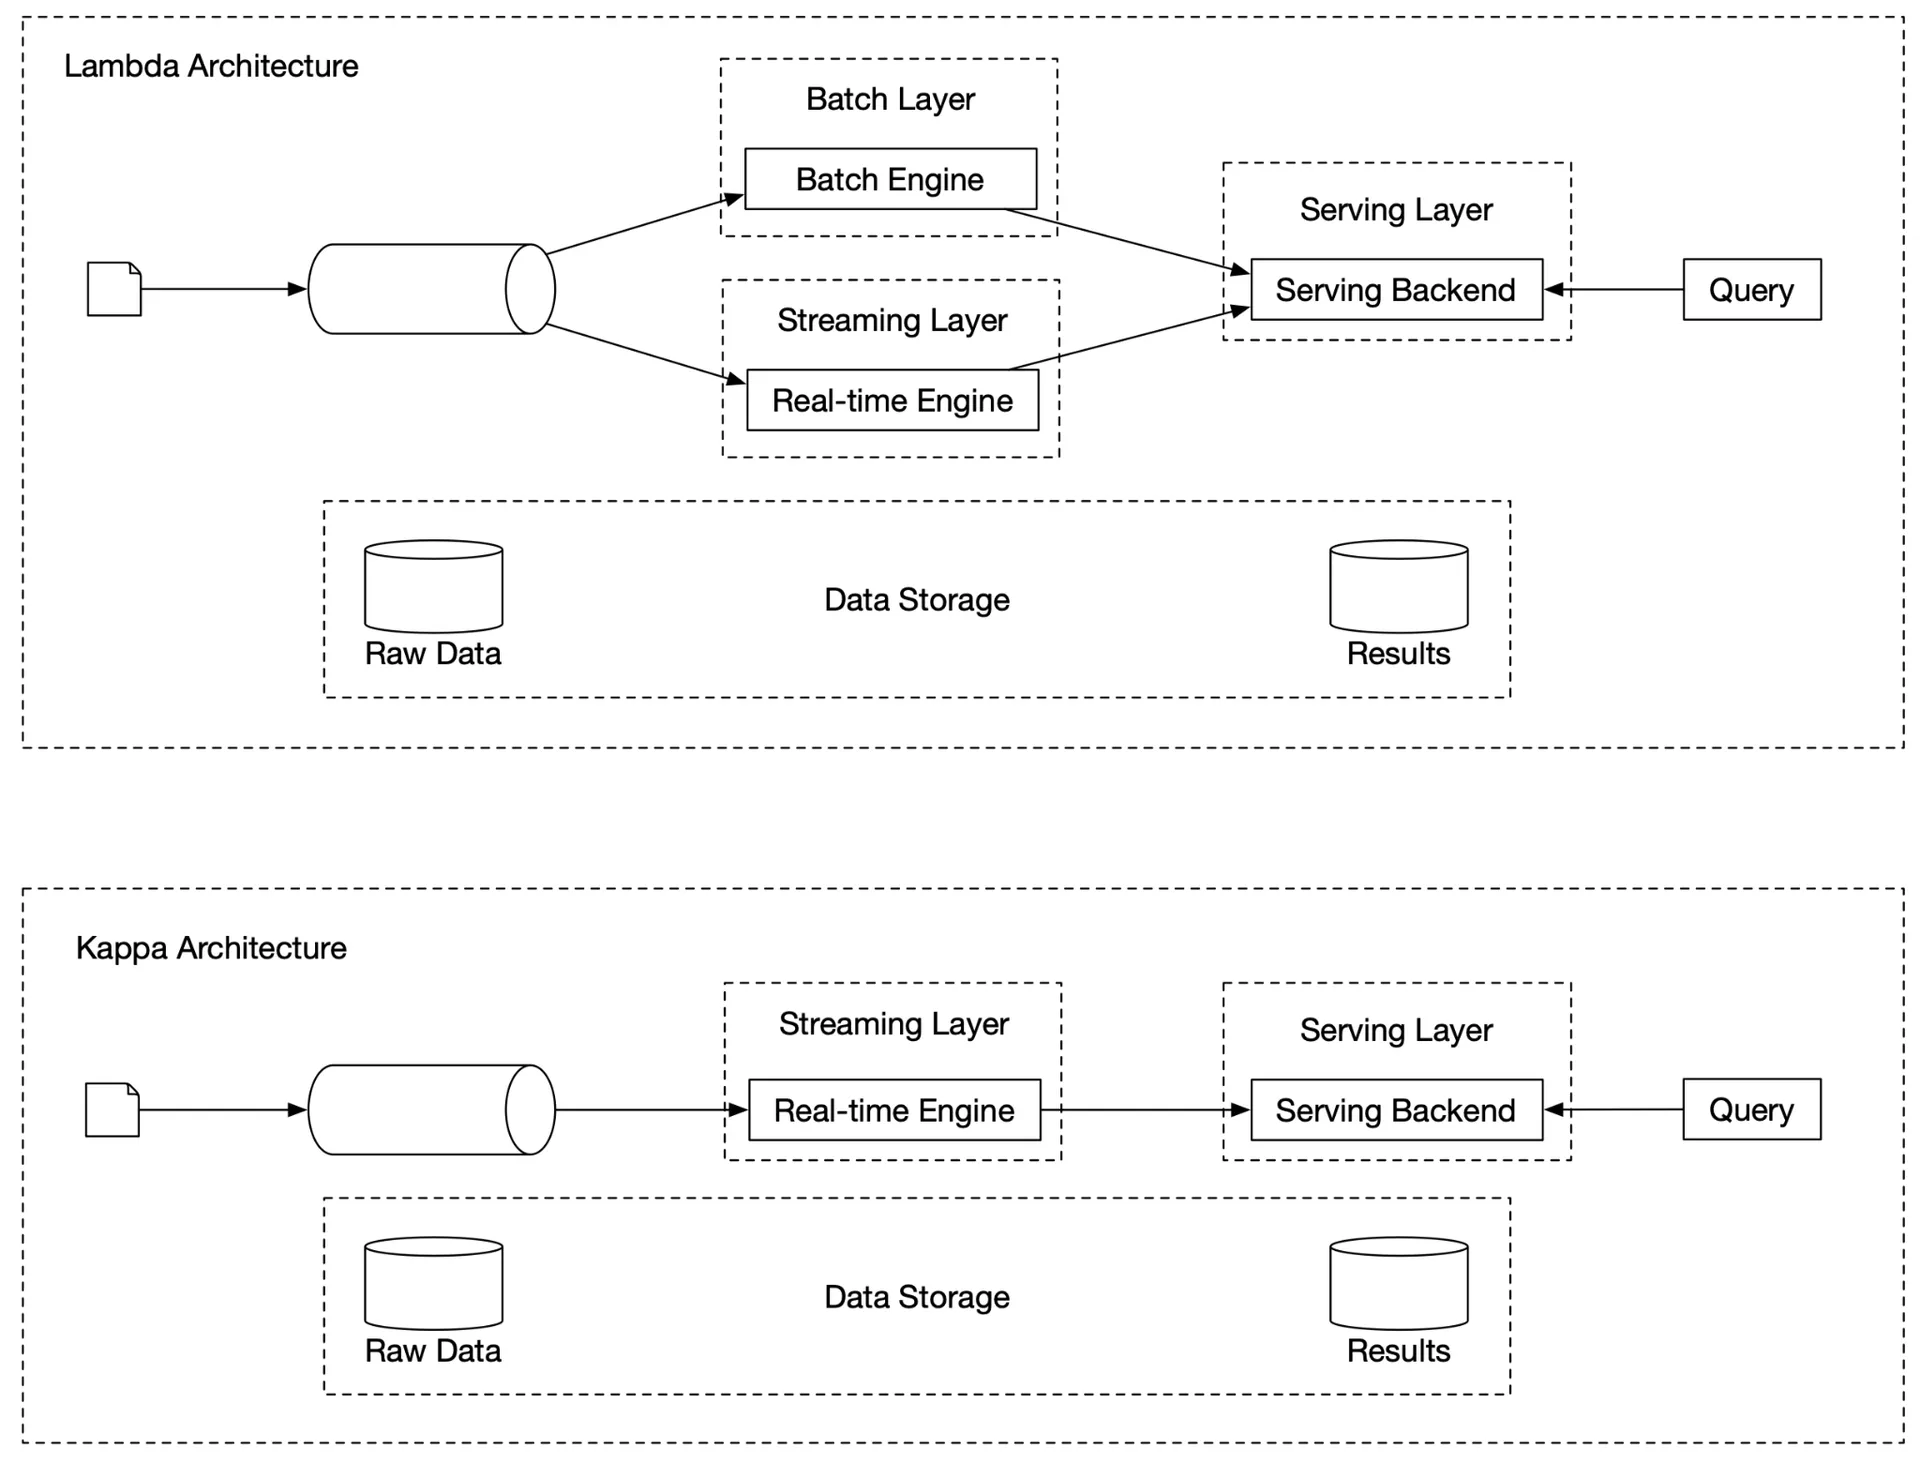
System uses both: streaming for real-time aggregation, batch for historical backup.
Lambda architecture: Two processing paths (batch + streaming). Con: two codebases. Kappa architecture: Single stream processing engine for both. Our design uses Kappa — historical replay goes through same aggregation service.
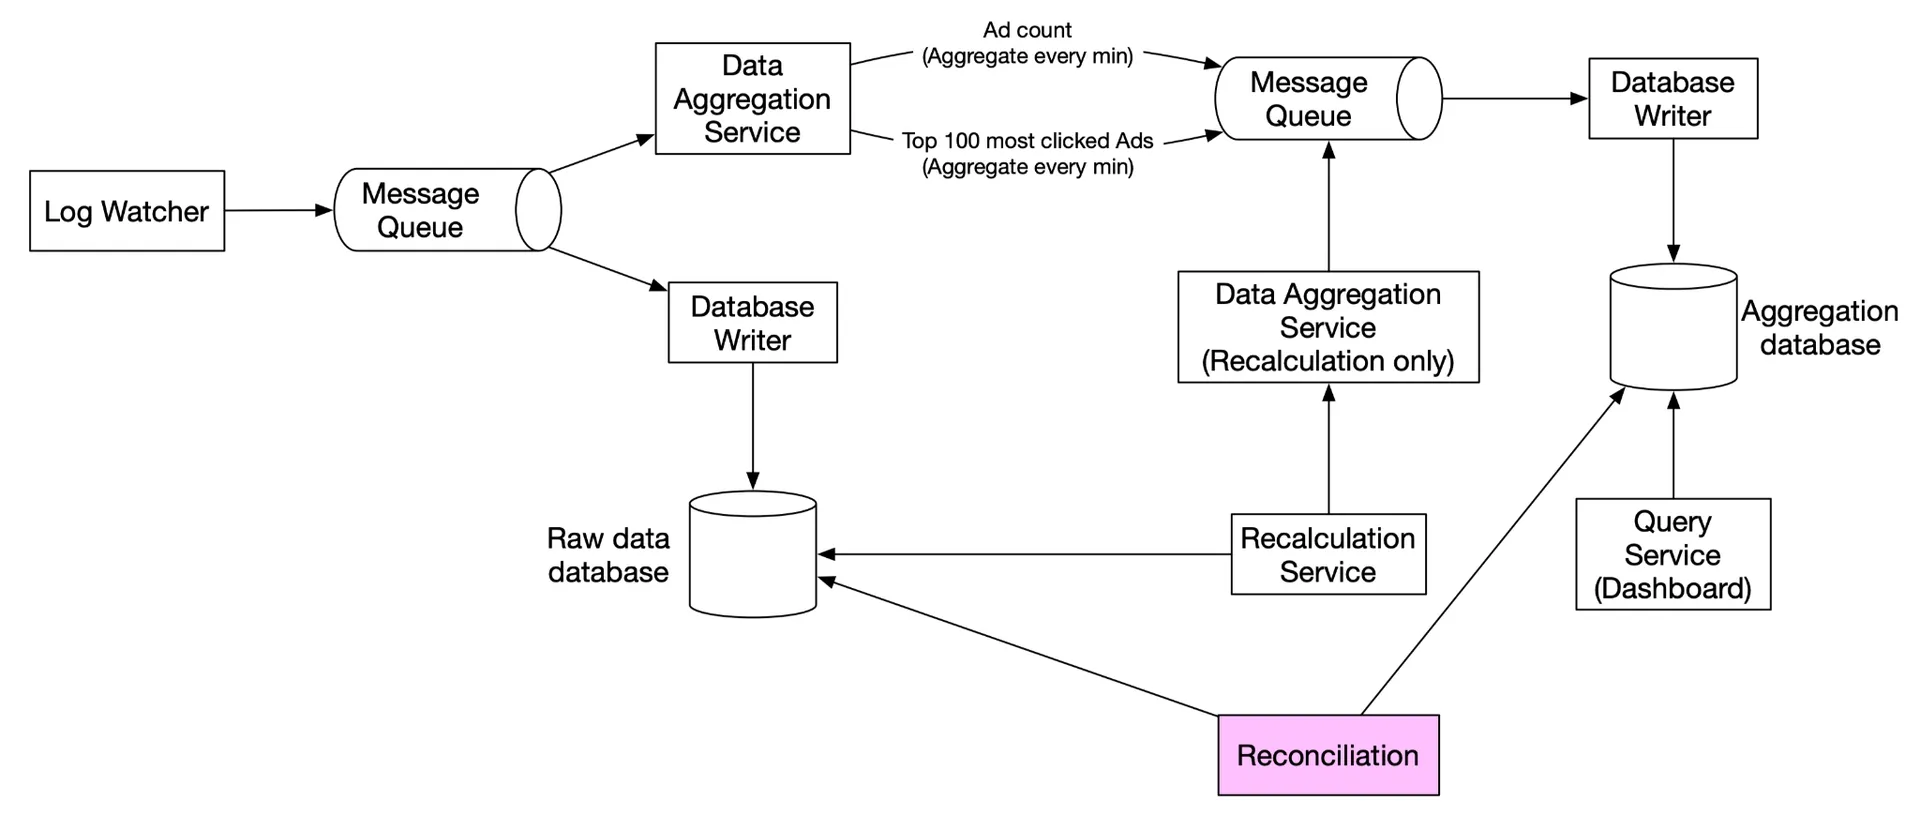
Data recalculation (historical replay)
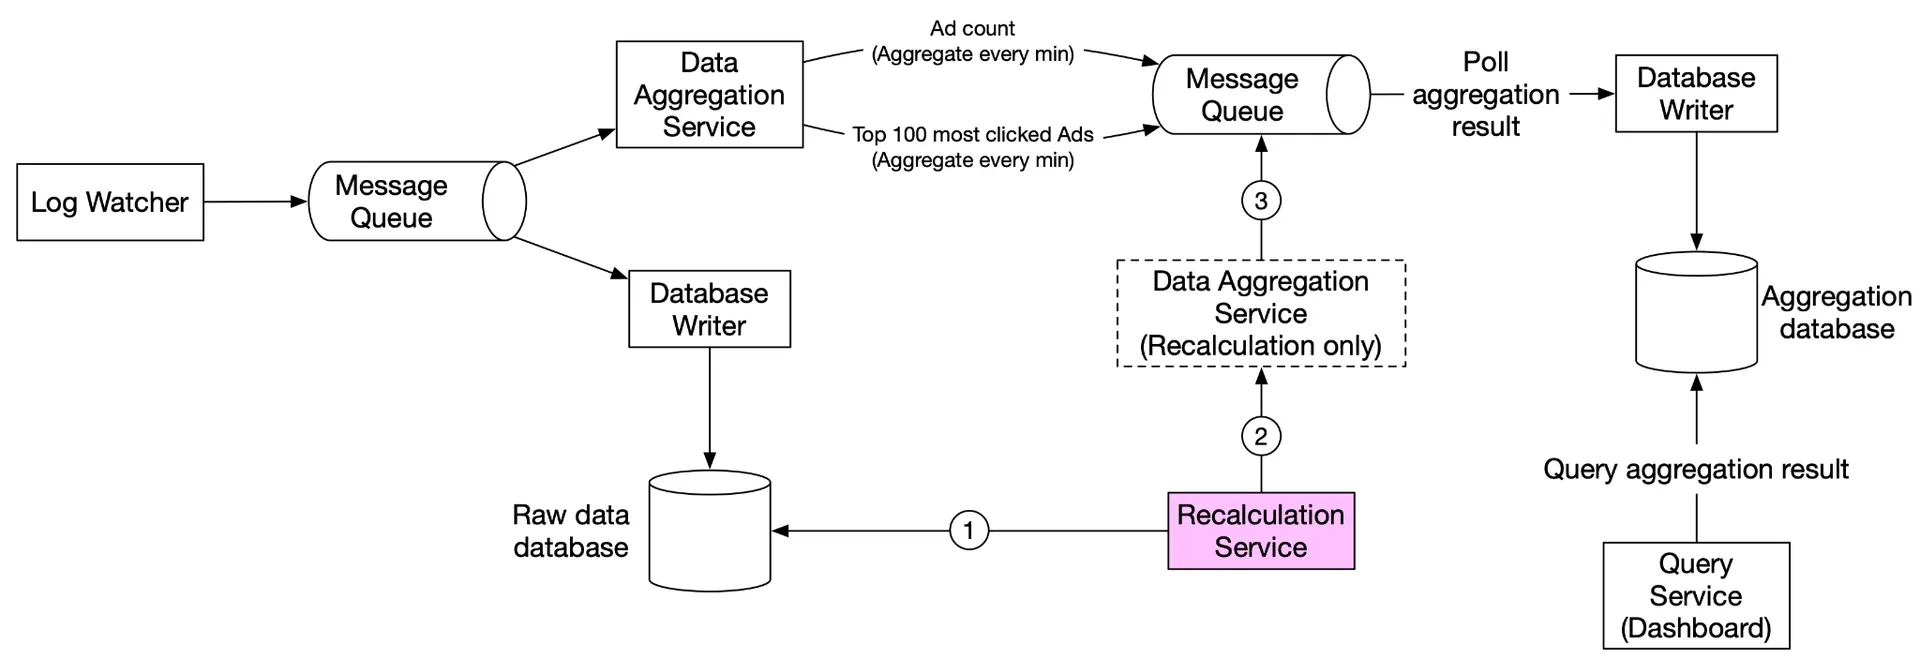
- Recalculation service retrieves raw data (batch job).
- Sends to dedicated aggregation service (doesn't impact real-time processing).
- Aggregated results → second Kafka → aggregation database.
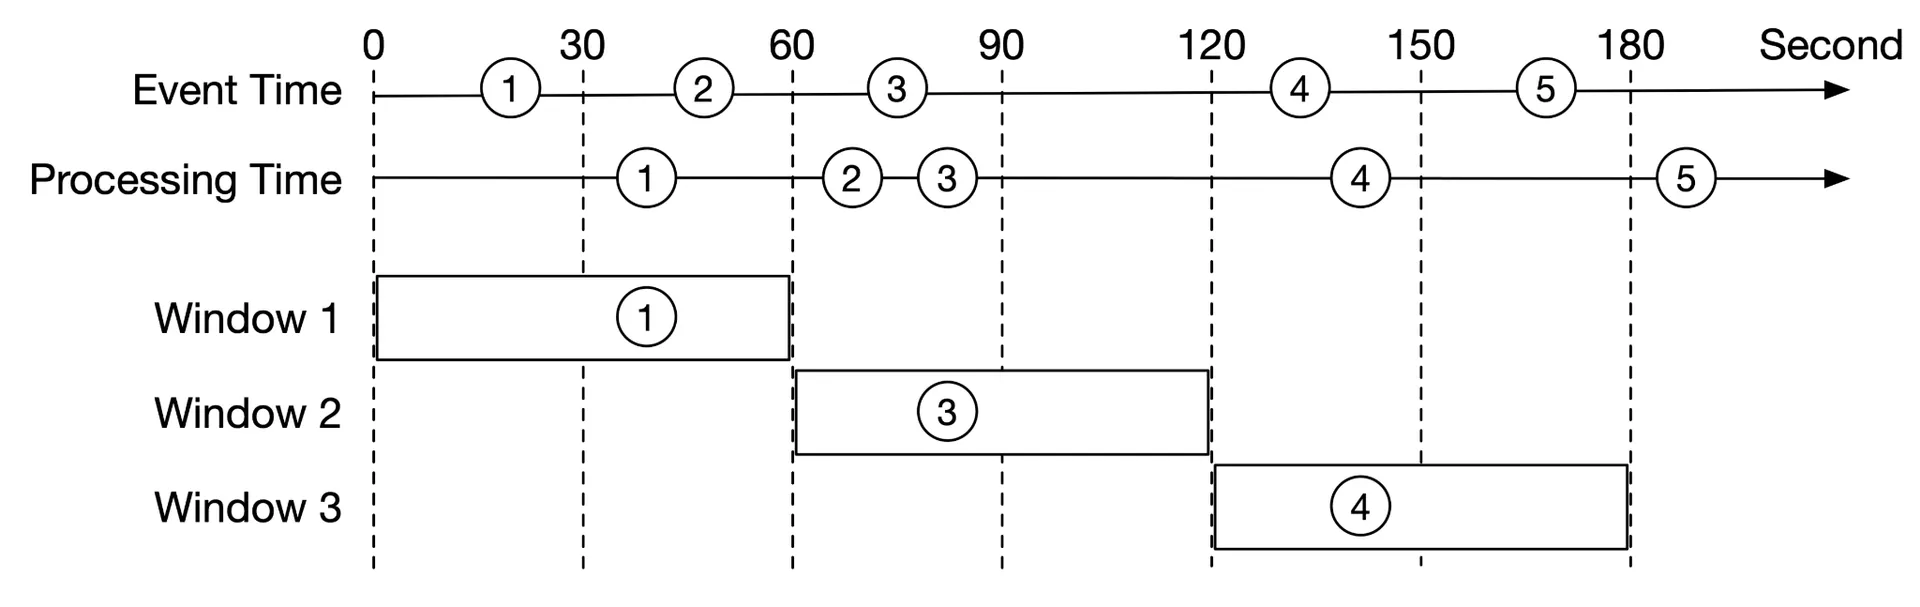
Time
Event time: When ad click happened. More accurate but depends on client clock (may be wrong/malicious).
Processing time: Server system time. More reliable but inaccurate for delayed events.
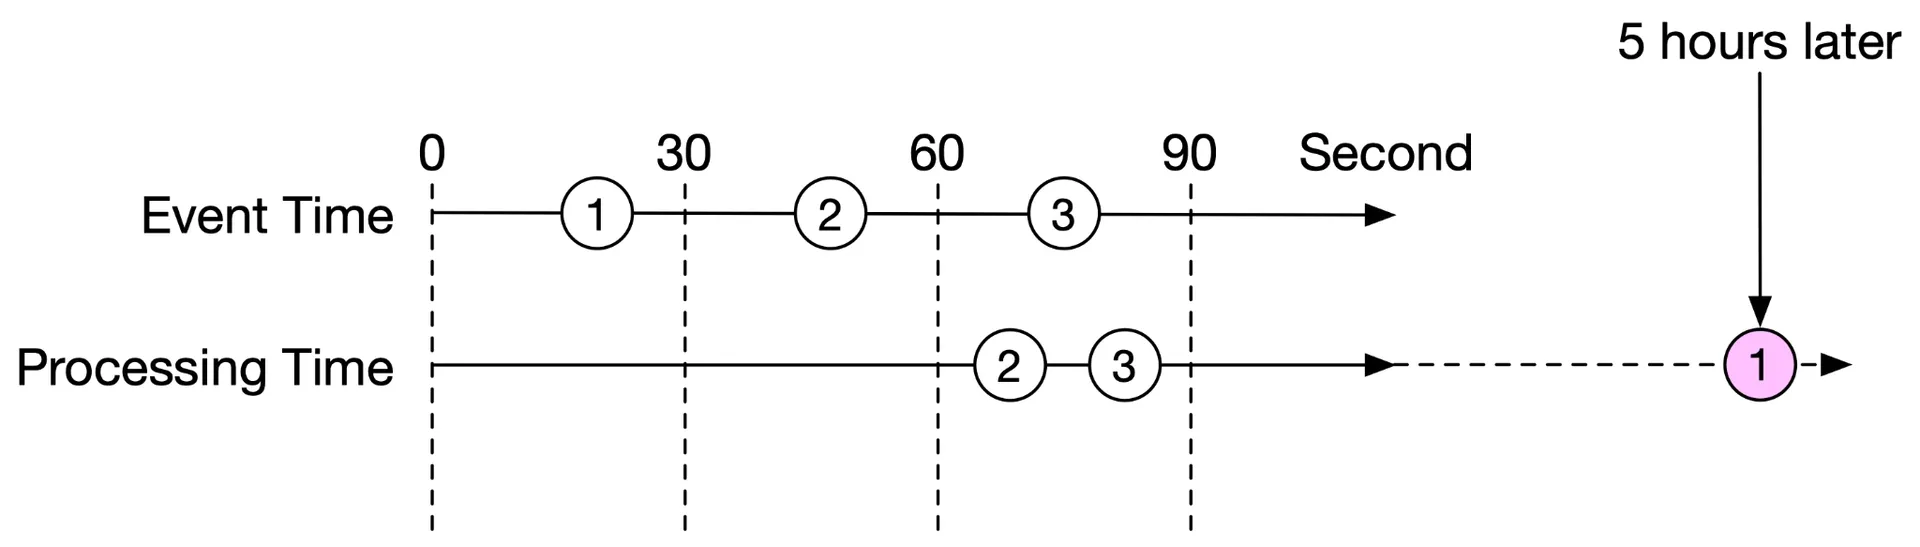
Recommendation: event time (data accuracy critical for billing).
Watermark technique
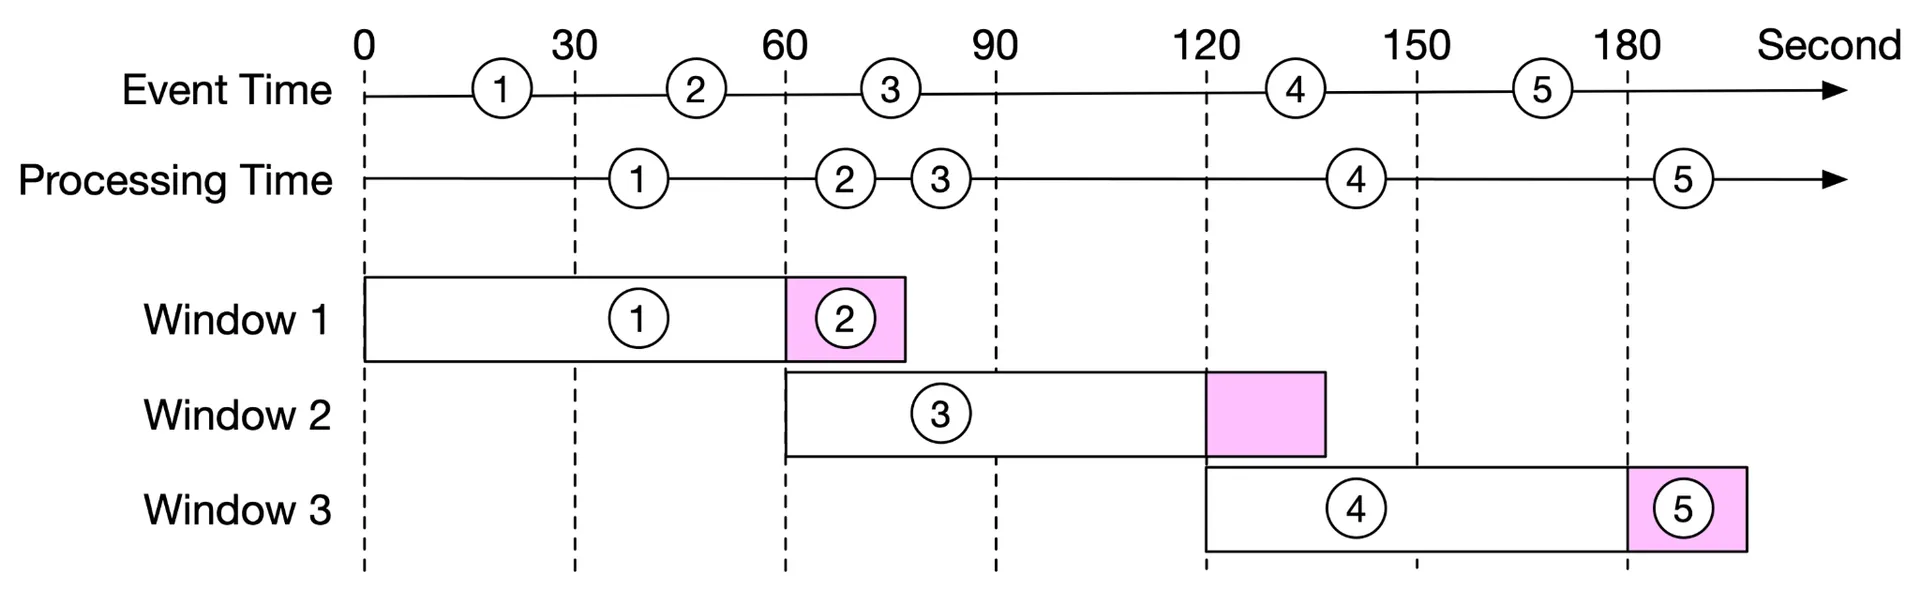
Extension of aggregation window to catch slightly delayed events. Example: 15s watermark extension. Tradeoff: longer watermark → more accurate but higher latency. Does NOT handle long-delayed events (low ROI for complex design). Minor inaccuracies corrected by end-of-day reconciliation.
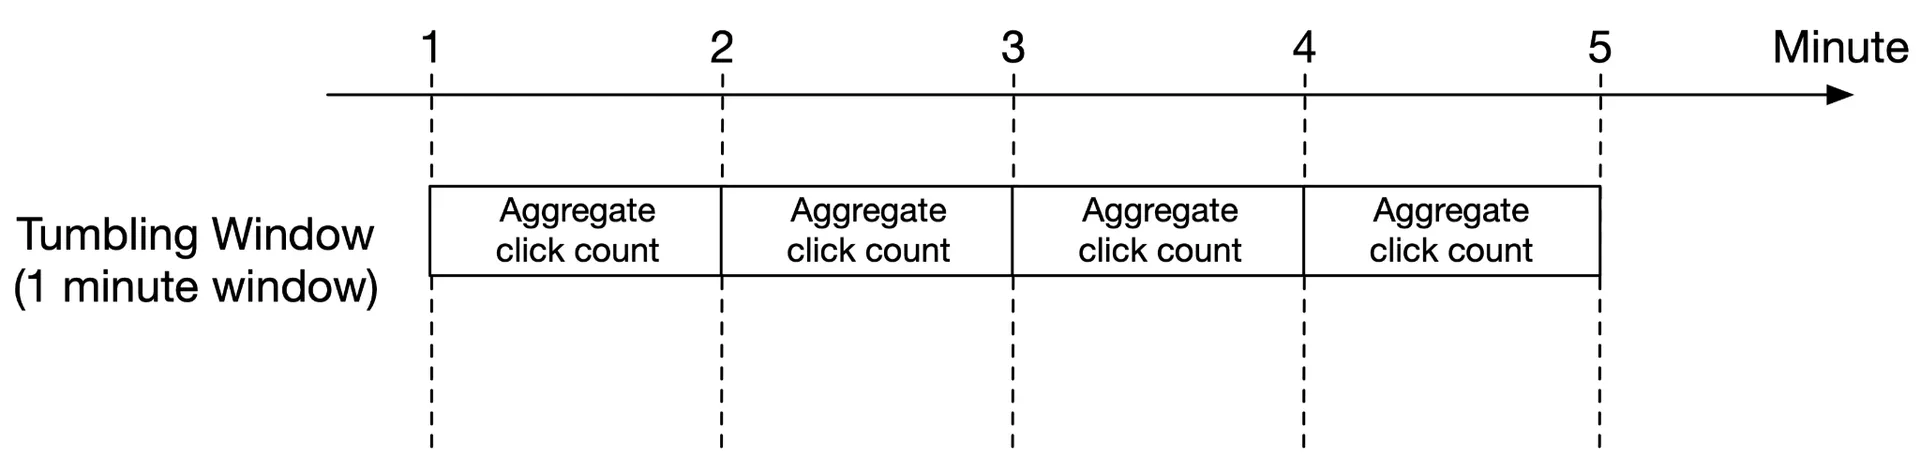
Aggregation window
Tumbling window (fixed): Equal-length, non-overlapping chunks. Used for per-minute click count aggregation.
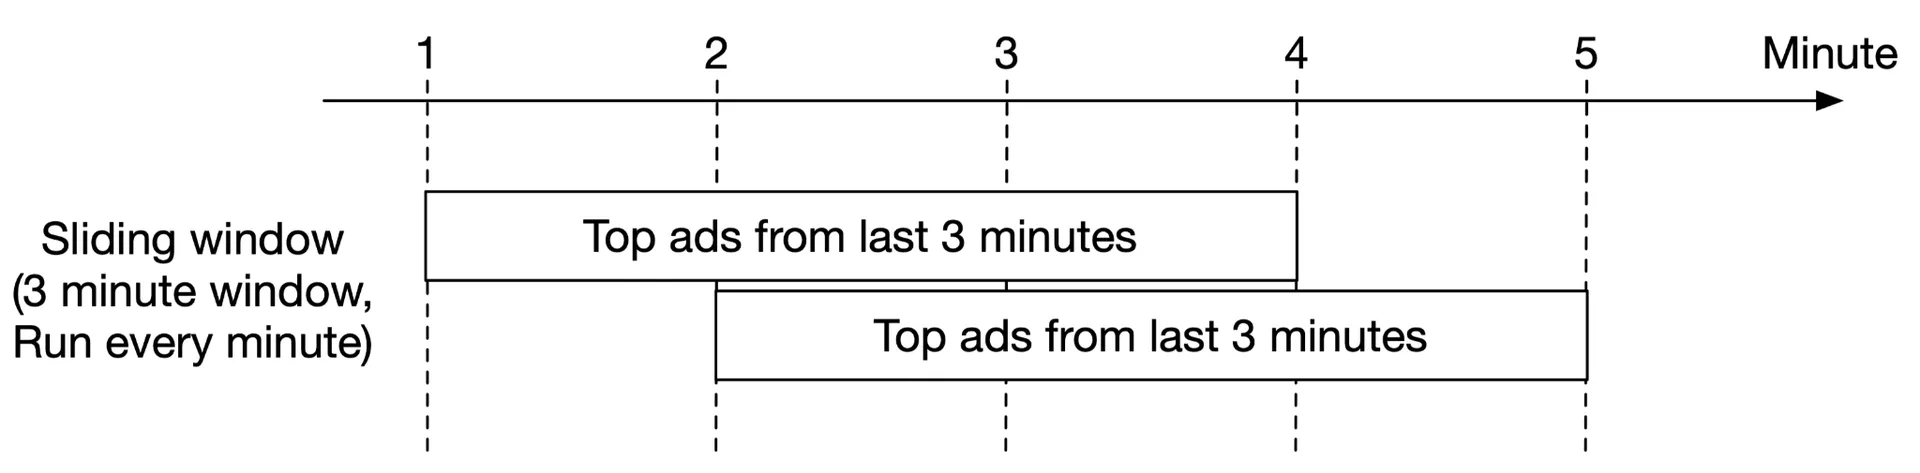
Sliding window: Overlapping windows sliding by specified interval. Used for "top N in last M minutes."
Delivery guarantees
At-least-once (small % duplicates acceptable) is NOT sufficient — discrepancies of millions of dollars. Exactly-once required.
Data deduplication
Sources of duplicates:
- Client-side: malicious/intentional resends (handled by ad fraud/risk control).
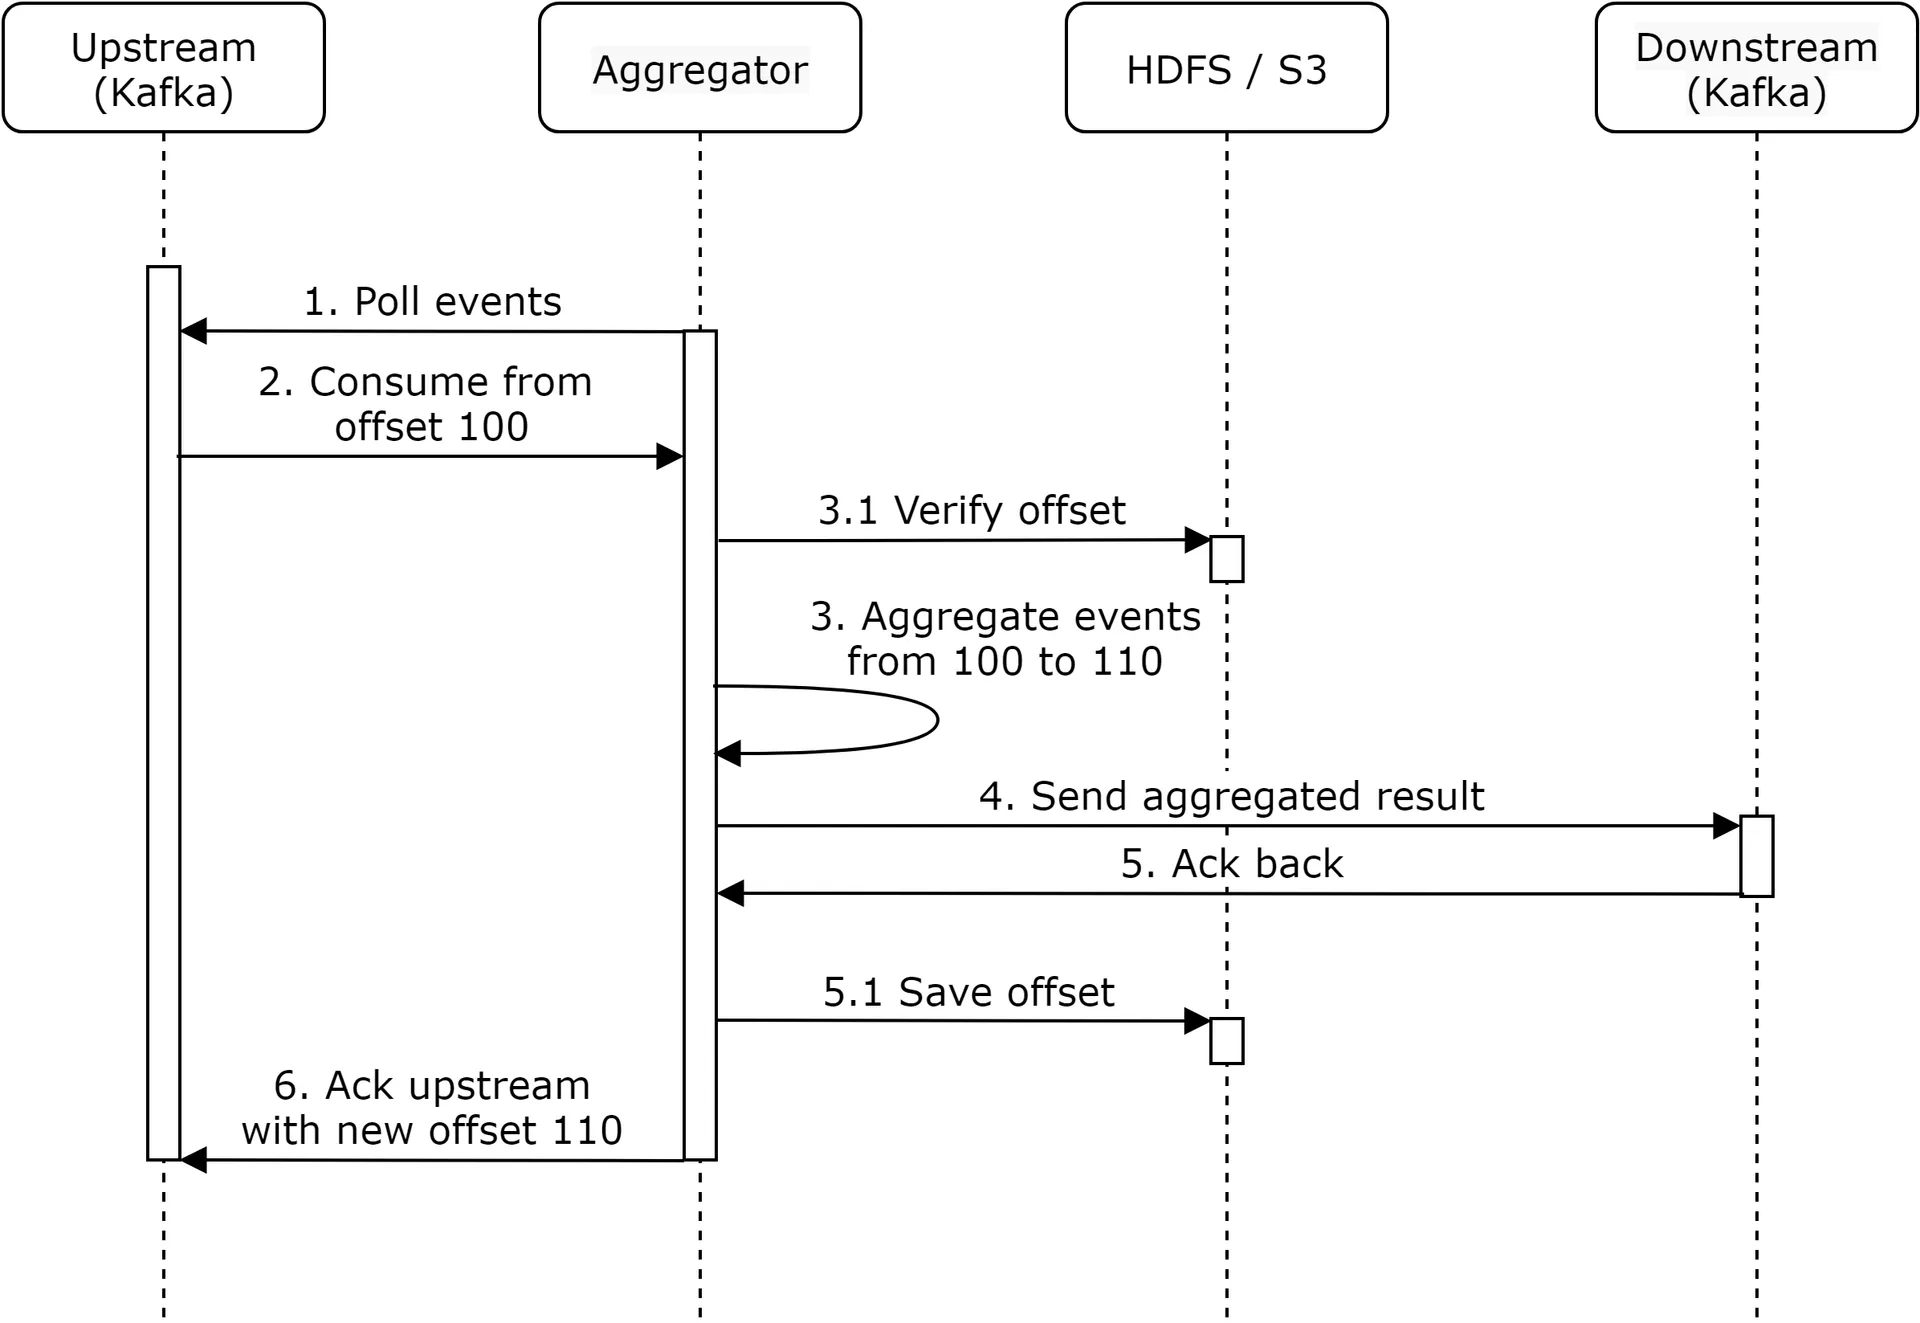
- Server outage: Aggregator crashes mid-aggregation; upstream offset not updated → new aggregator replays already-processed events.
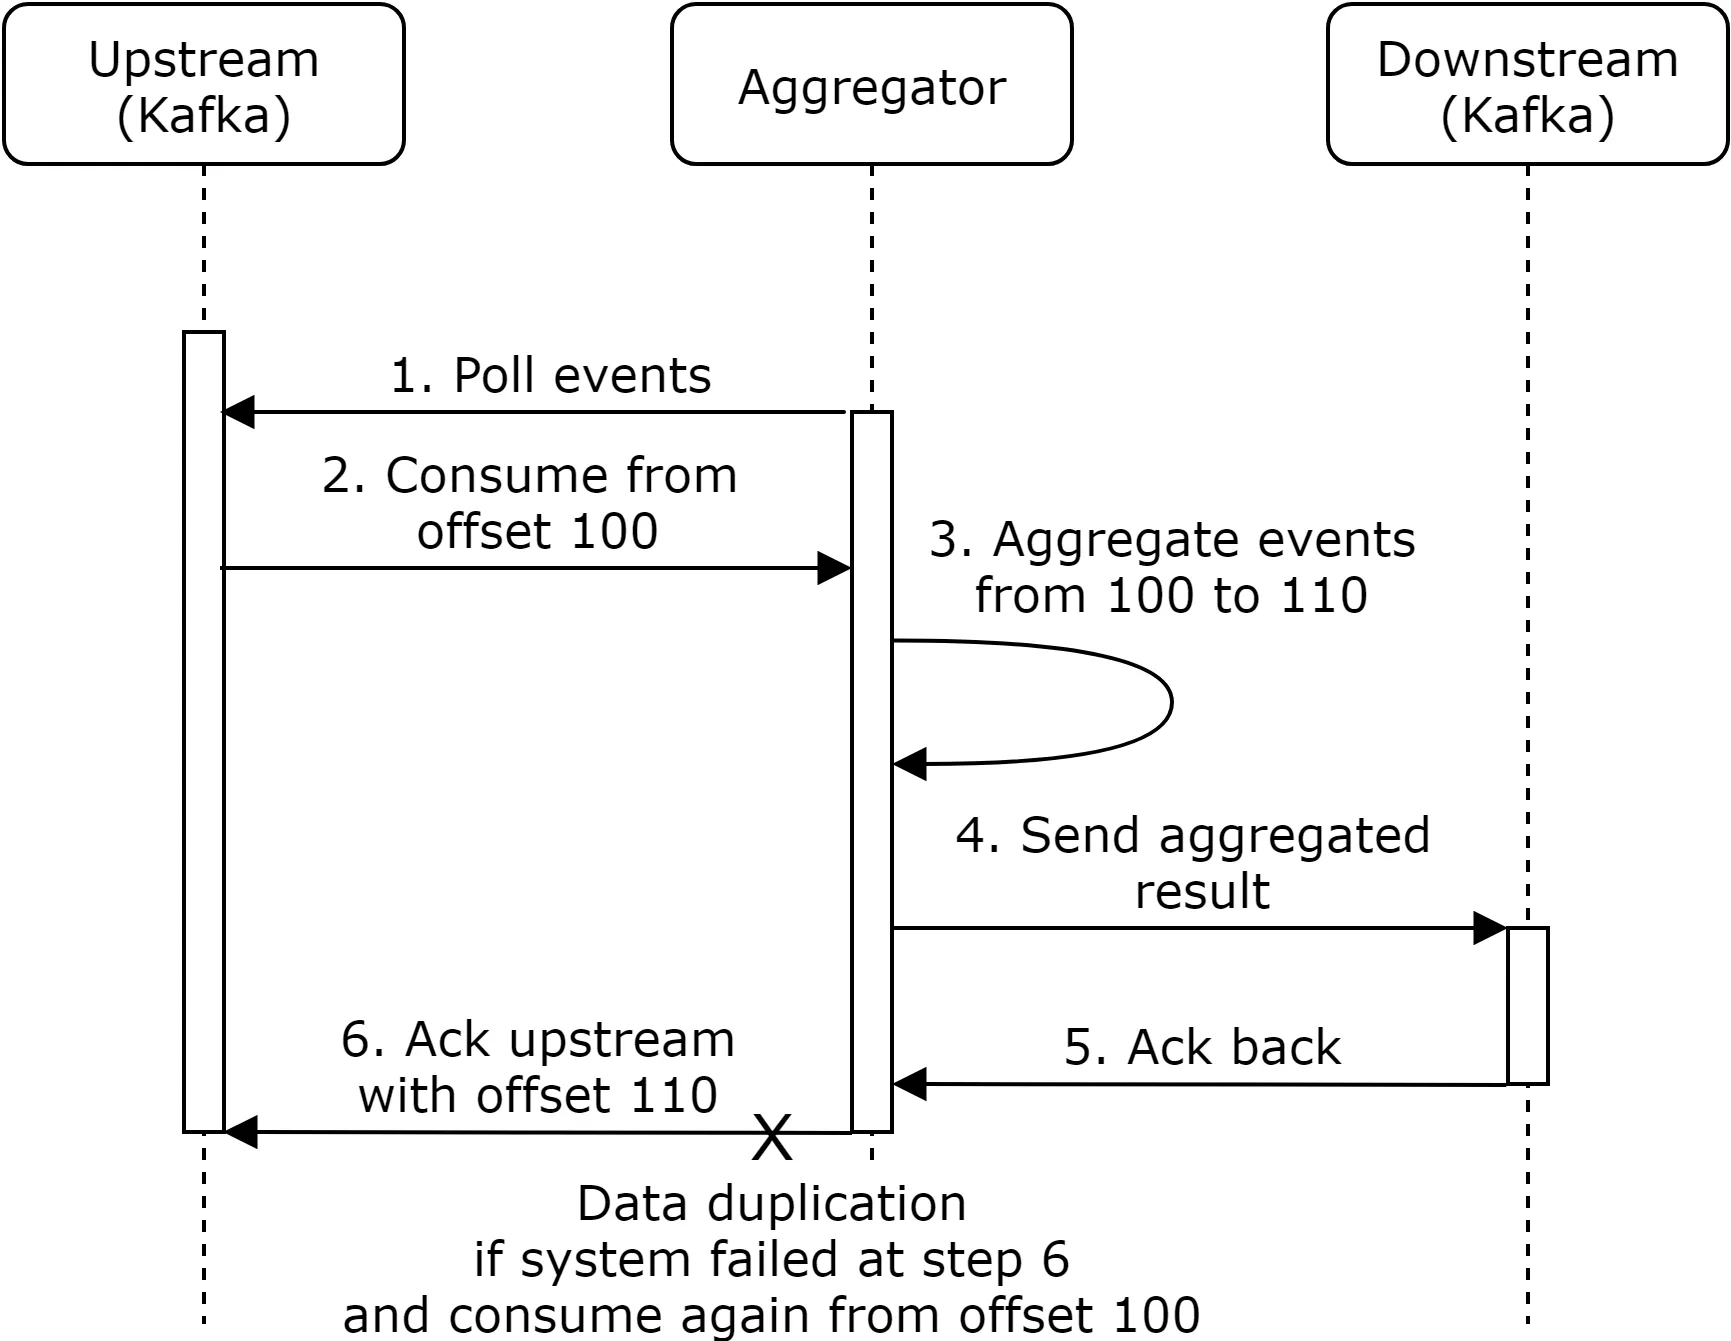
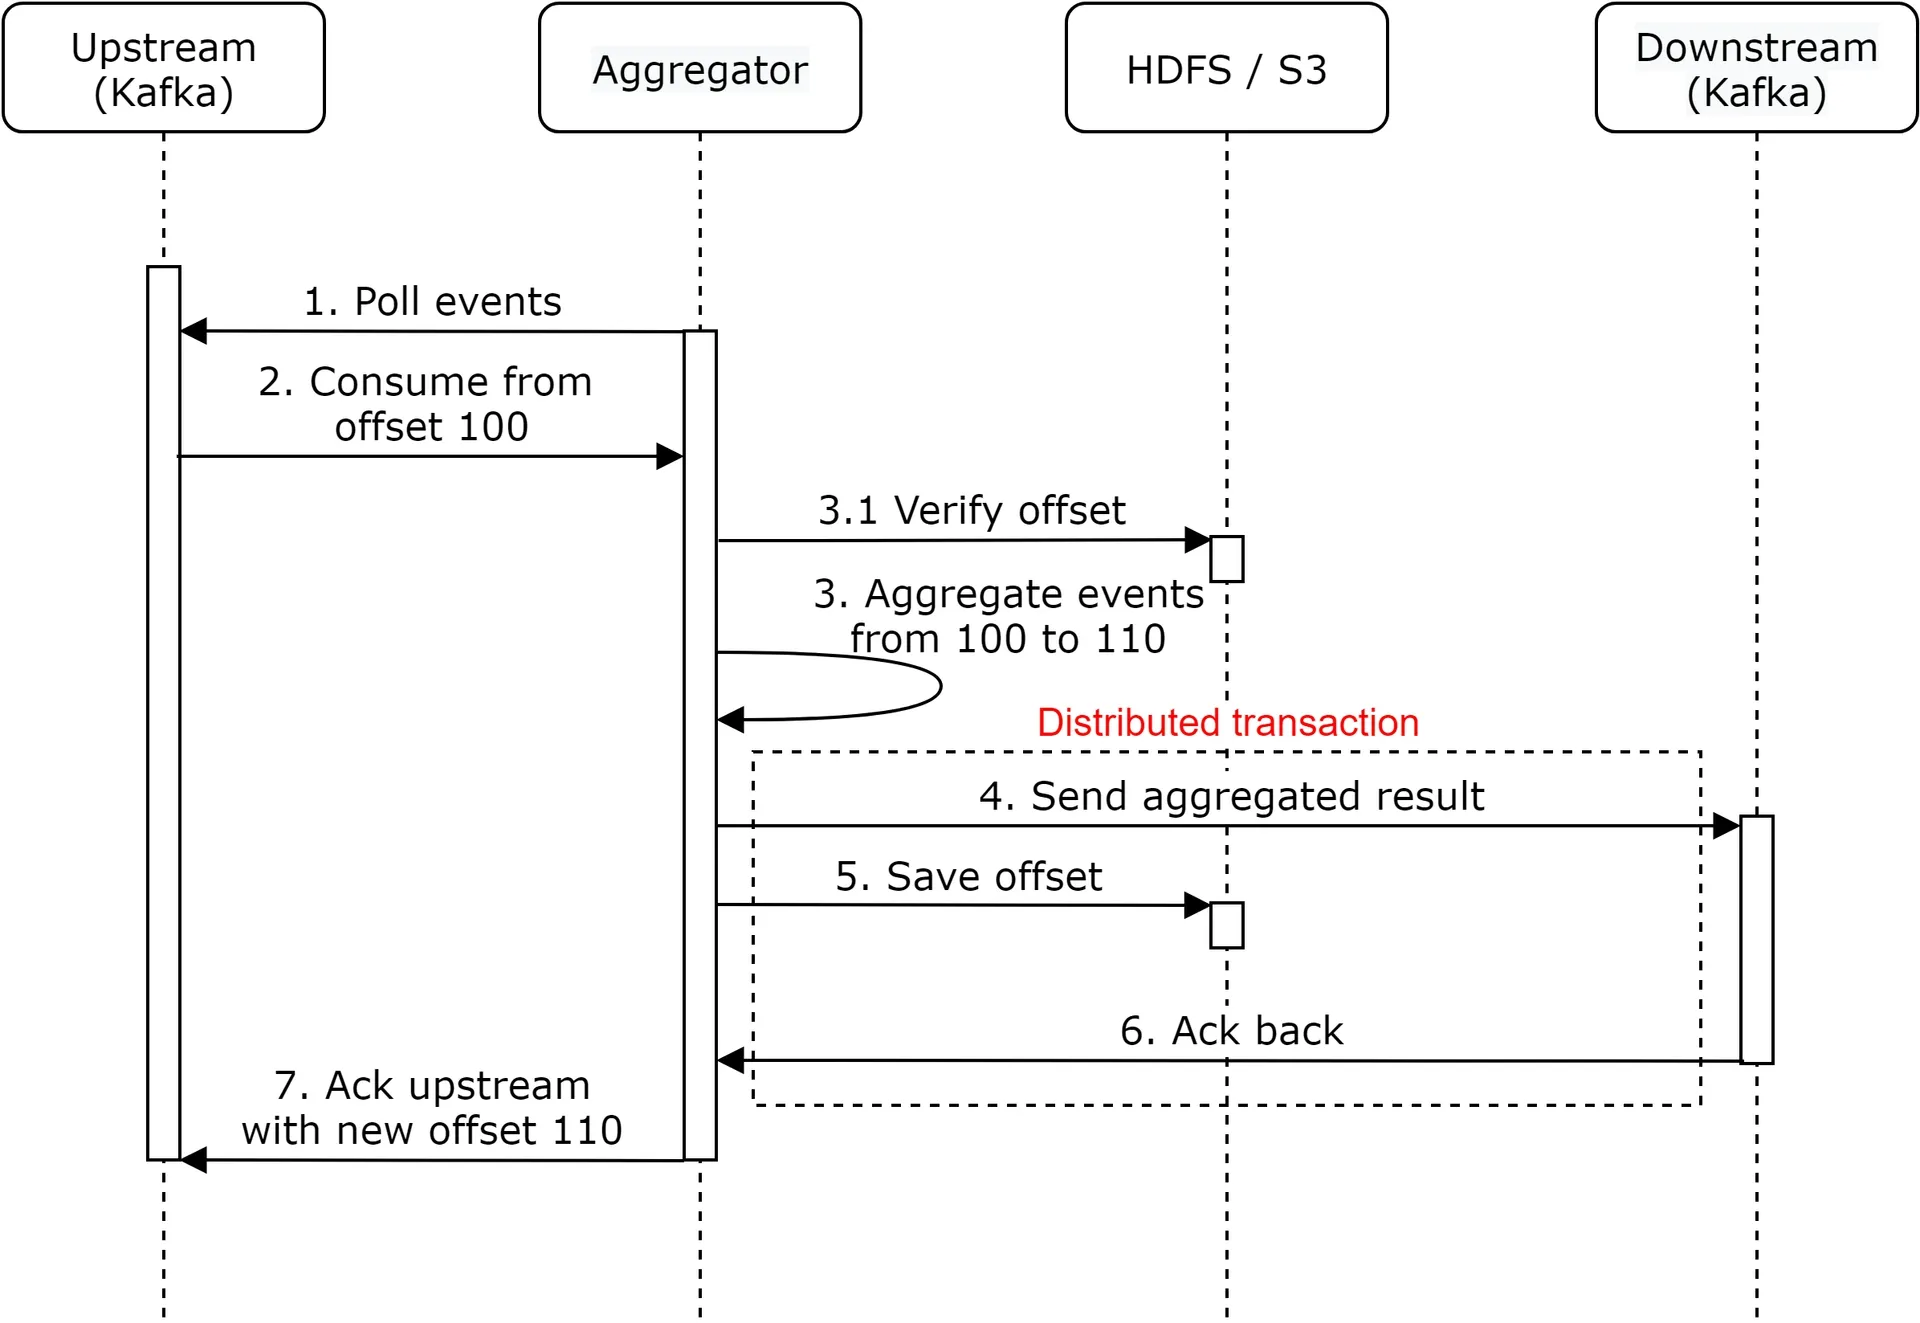
Solution: distributed transaction. Save offset AND send results atomically. If any step fails, entire transaction rolls back.
Scale the system
Three decoupled components → scale independently.
Message queue
- Producers: Unlimited instances.
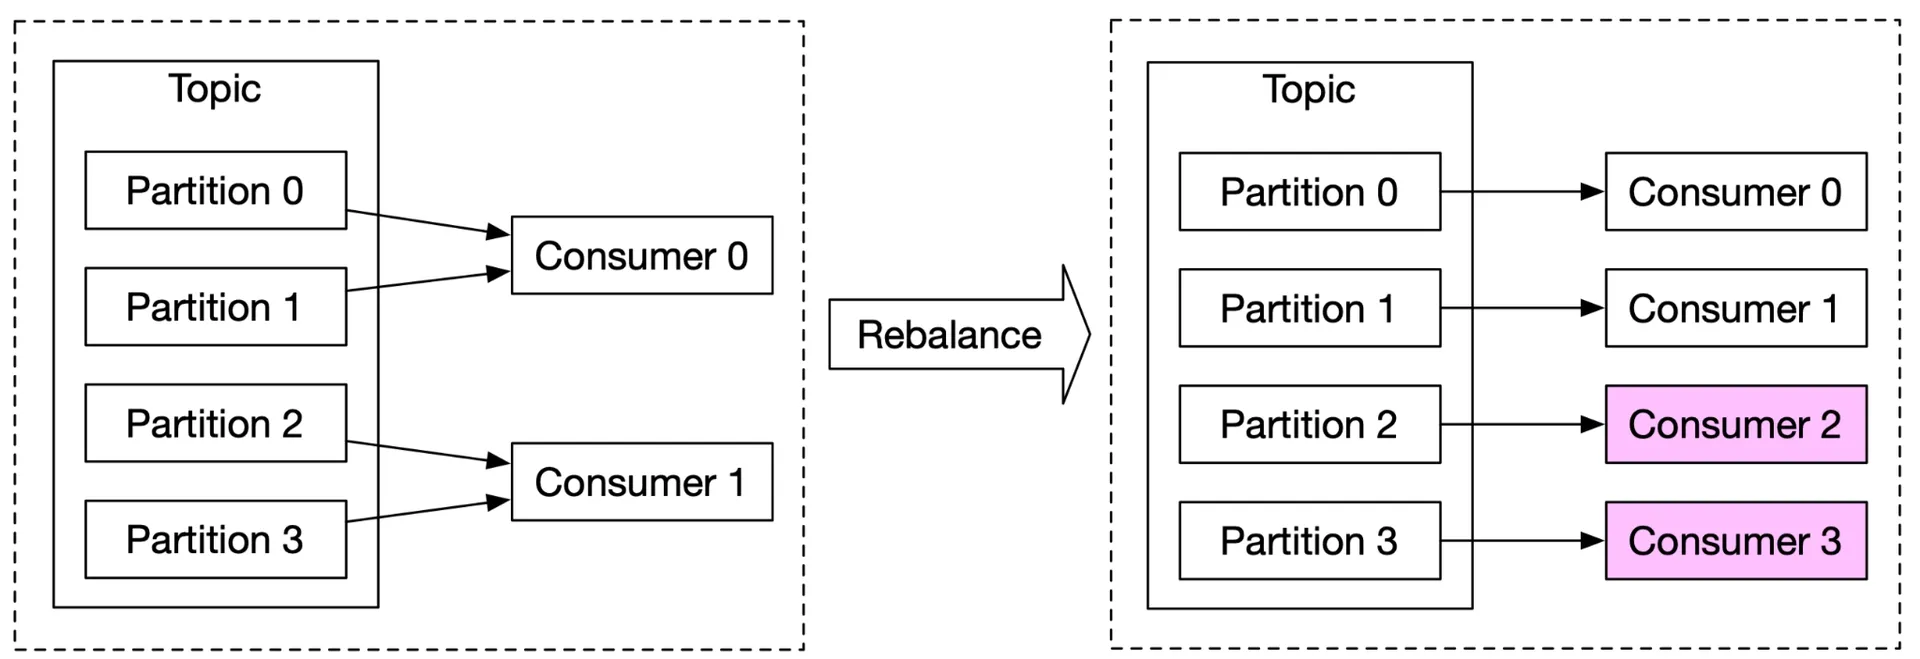
- Consumers: Consumer group rebalancing. Add during off-peak (rebalance is slow with hundreds of consumers).
- Brokers:
- Hash key =
ad_id→ same ad_id events in same partition. - Pre-allocate enough partitions (avoid dynamic increase).
- Topic physical sharding: by geography (topic_north_america, etc.) or business type. Increases throughput; adds complexity.
- Hash key =
Aggregation service
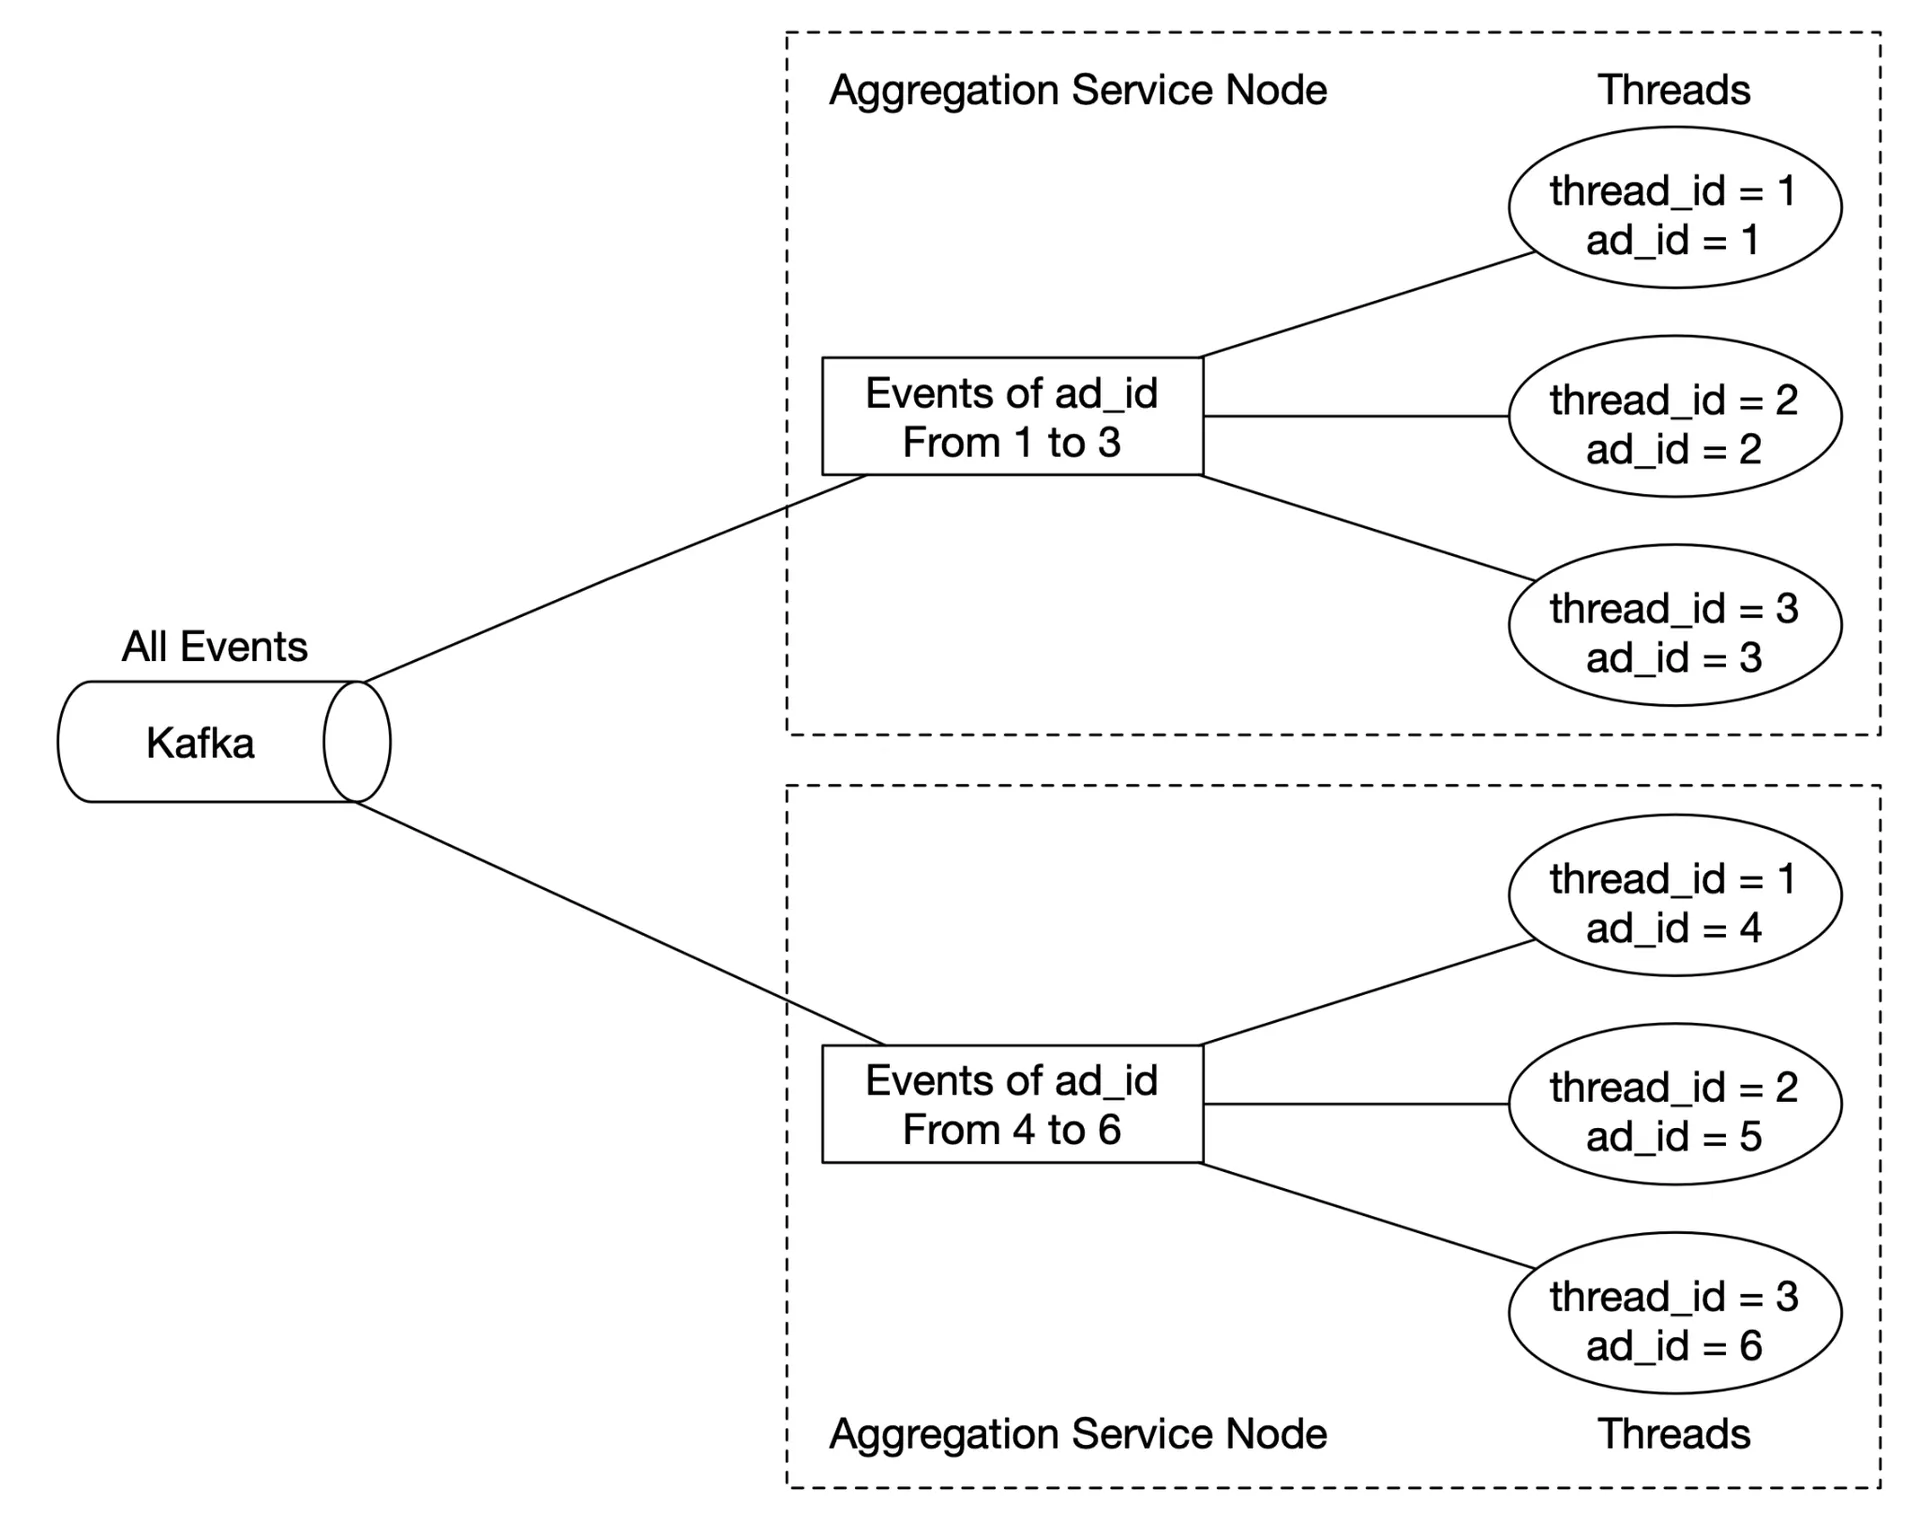
Horizontally scalable. Two options for throughput:
- Multi-threading (events by ad_id → different threads).
- Resource providers (YARN) → multi-processing. More common in practice.
Database
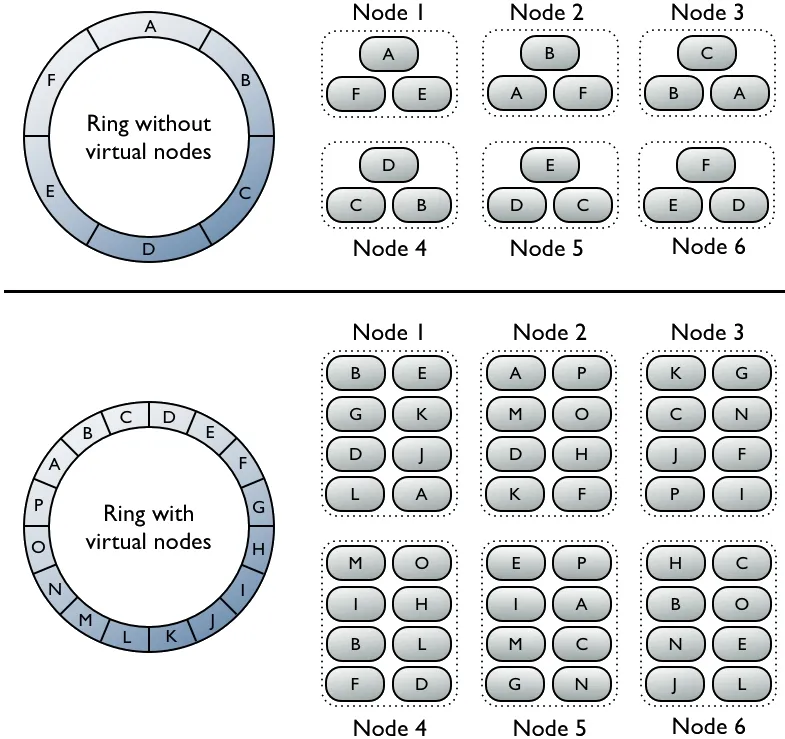
Cassandra natively supports horizontal scaling via virtual nodes + consistent hashing. Data evenly distributed with replication factor. Adding node → auto-rebalances. No manual resharding.
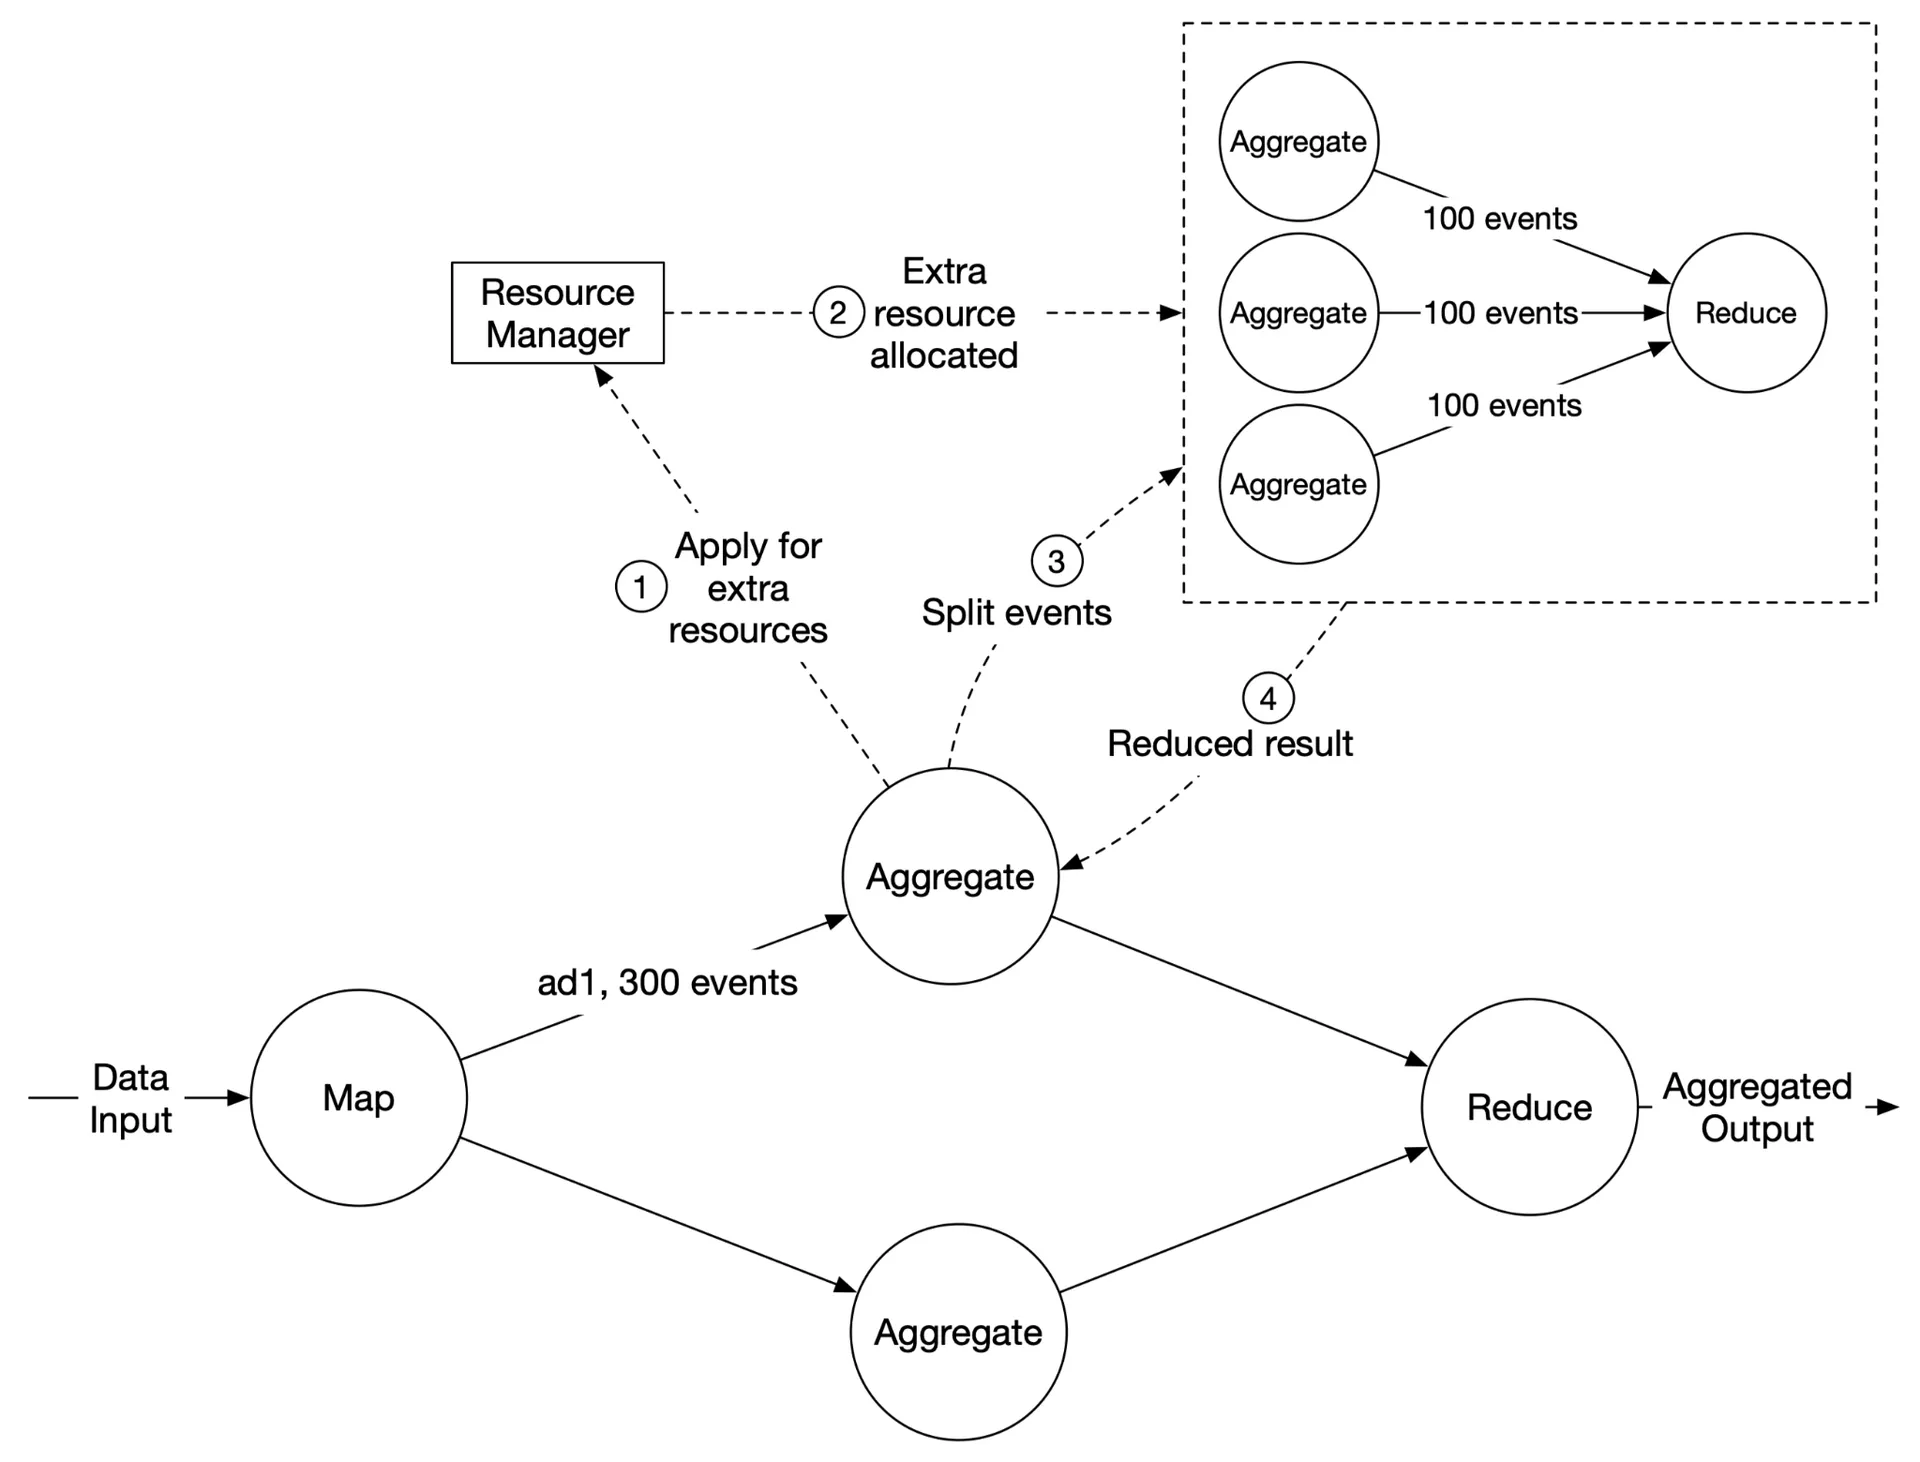
Hotspot issue
Popular ads (major advertisers with million-dollar budgets) get more clicks. Since events partitioned by ad_id, some aggregation nodes overload.
Mitigation: Allocate more aggregation nodes for popular ads via resource manager. Original node splits events → multiple nodes process → results written back.
More sophisticated: Global-Local Aggregation, Split Distinct Aggregation.
Fault tolerance
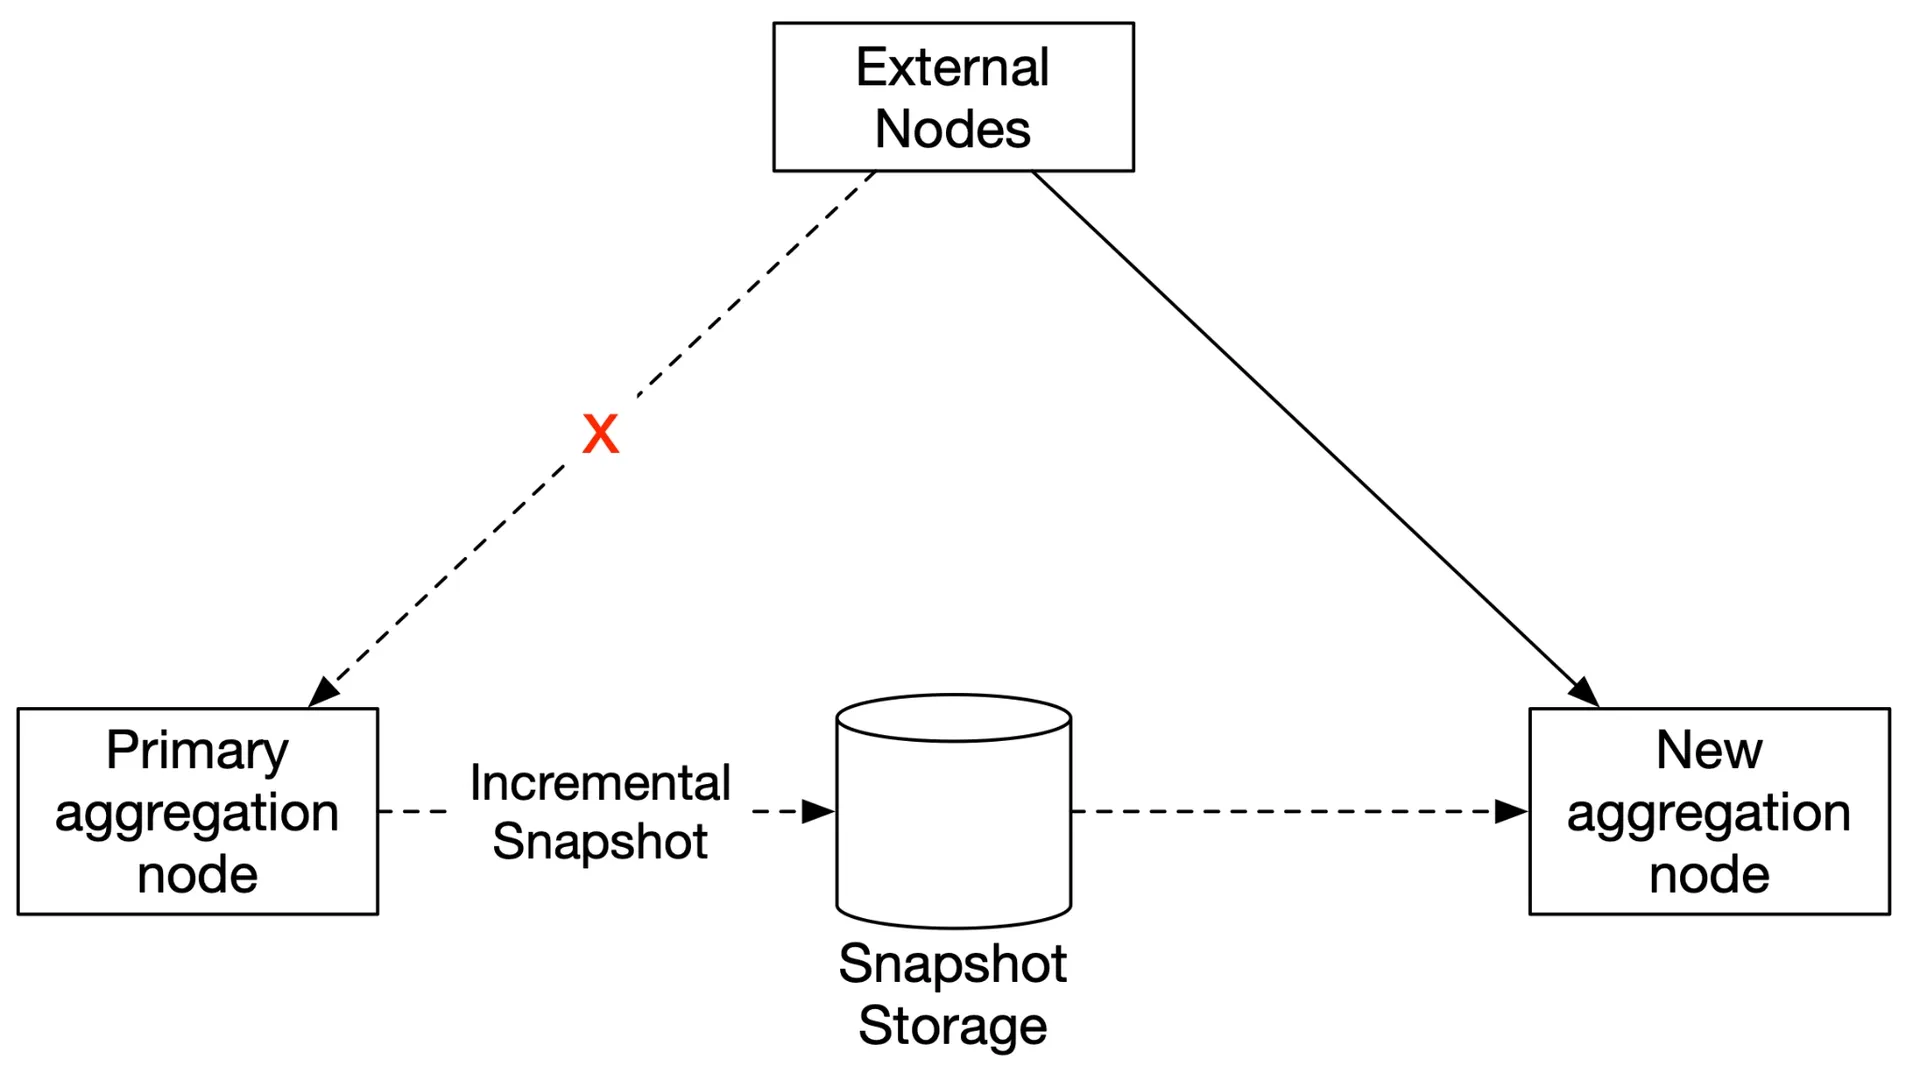
Aggregation is in-memory → node crash loses results. Rebuild by replaying from upstream Kafka. Use snapshots (system state + upstream offset + top N data) to avoid replaying from beginning.
Failover: bring up new node → recover from latest snapshot → replay events after snapshot from Kafka.
Data monitoring and correctness
Continuous monitoring:
- Latency: track timestamps through each stage; differences = latency metrics.
- Message queue size: sudden increase → add aggregation nodes. For Kafka: monitor records-lag.
- Aggregation node resources: CPU, disk, JVM.
Reconciliation: End-of-day batch job: sort events by event time in each partition → compare with real-time aggregation result. May not match exactly (late events). For higher accuracy: use hourly windows.
Alternative design
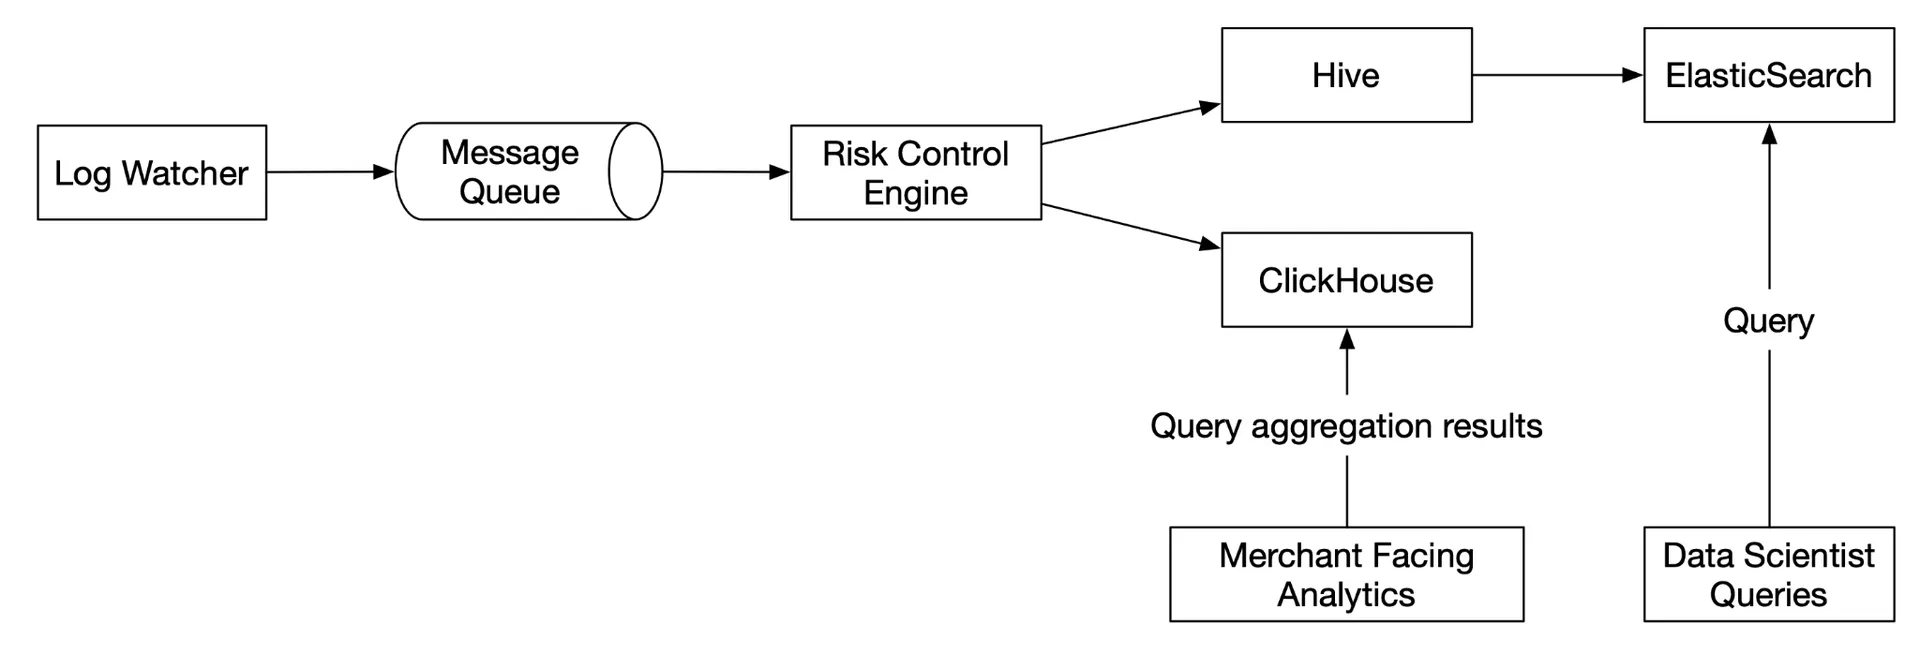
Store ad click data in Hive with ElasticSearch layer for fast queries. Aggregation in OLAP databases (ClickHouse, Druid).
Step 4 - Wrap Up
Key topics: MapReduce DAG for aggregation, Kappa architecture (streaming + batch replay combined), watermark for delayed events, distributed transactions for exactly-once, consistent hashing for Cassandra scaling, hotspot mitigation via resource manager, snapshot-based fault tolerance, and reconciliation for correctness.